SLIDE 1 This translation is to be used solely as a reference and the consolidated financial statements in this release are unaudited.
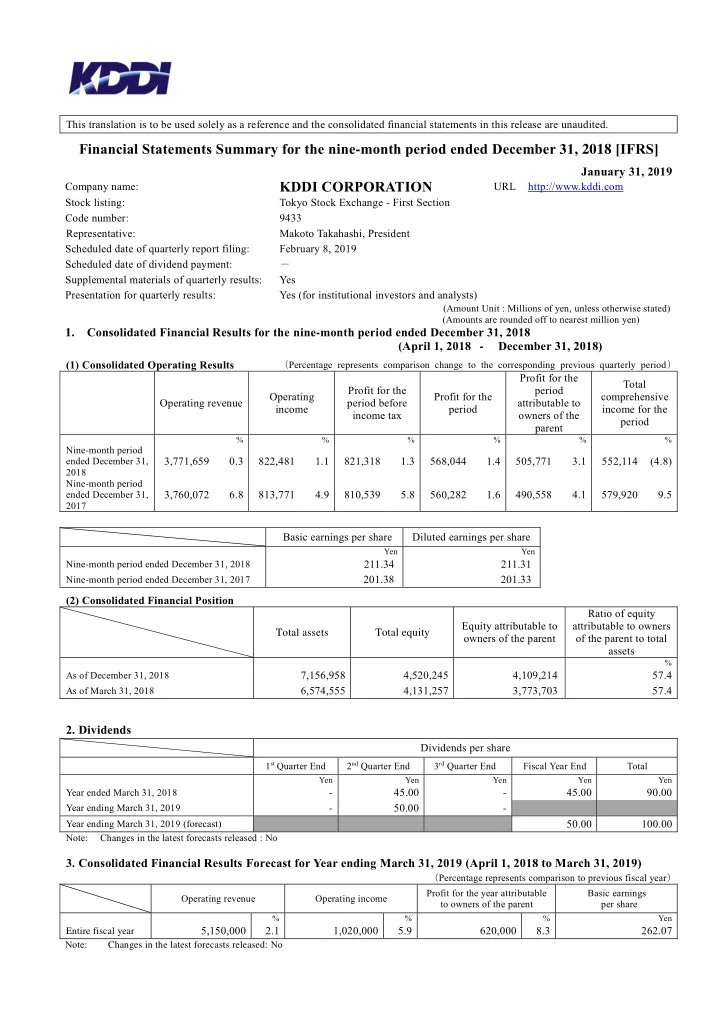
Financial Statements Summary for the nine-month period ended December 31, 2018 [IFRS]
January 31, 2019
Company name:
KDDI CORPORATION
URL http://www.kddi.com Stock listing: Tokyo Stock Exchange - First Section Code number: 9433 Representative: Makoto Takahashi, President Scheduled date of quarterly report filing: February 8, 2019 Scheduled date of dividend payment: - Supplemental materials of quarterly results: Yes Presentation for quarterly results: Yes (for institutional investors and analysts)
(Amount Unit : Millions of yen, unless otherwise stated) (Amounts are rounded off to nearest million yen)
- 1. Consolidated Financial Results for the nine-month period ended December 31, 2018
(April 1, 2018 - December 31, 2018)
(1) Consolidated Operating Results
(Percentage represents comparison change to the corresponding previous quarterly period)
Operating revenue Operating income Profit for the period before income tax Profit for the period Profit for the period attributable to
parent Total comprehensive income for the period
% % % % % %
Nine-month period ended December 31, 2018
3,771,659 0.3 822,481 1.1 821,318 1.3 568,044 1.4 505,771 3.1 552,114 (4.8)
Nine-month period ended December 31, 2017
3,760,072 6.8 813,771 4.9 810,539 5.8 560,282 1.6 490,558 4.1 579,920 9.5 Basic earnings per share Diluted earnings per share
Yen Yen
Nine-month period ended December 31, 2018
211.34 211.31
Nine-month period ended December 31, 2017
201.38 201.33 (2) Consolidated Financial Position Total assets Total equity Equity attributable to
Ratio of equity attributable to owners
assets
%
As of December 31, 2018
7,156,958 4,520,245 4,109,214 57.4
As of March 31, 2018
6,574,555 4,131,257 3,773,703 57.4
Dividends per share
1st Quarter End 2nd Quarter End 3rd Quarter End Fiscal Year End Total
Yen Yen Yen Yen Yen
Year ended March 31, 2018
90.00
Year ending March 31, 2019
- 50.00
- Year ending March 31, 2019 (forecast)
50.00 100.00
Note: Changes in the latest forecasts released : No
- 3. Consolidated Financial Results Forecast for Year ending March 31, 2019 (April 1, 2018 to March 31, 2019)
(Percentage represents comparison to previous fiscal year) Operating revenue Operating income Profit for the year attributable to owners of the parent Basic earnings per share
% % % Yen
Entire fiscal year
5,150,000 2.1 1,020,000 5.9 620,000 8.3 262.07
Note: Changes in the latest forecasts released: No
SLIDE 2 Notes
(1) Changes in significant consolidated subsidiaries (which resulted in changes in scope of consolidation) during the nine-month period ended December 31, 2018 : None (2) Changes in accounting policies and estimates 1) Changes in accounting policies required under IFRSs : Yes 2) Other changes in accounting policies : Yes 3) Changes in accounting estimates : None (3) Numbers of outstanding shares (Common Stock) 1) Number of shares outstanding (inclusive of treasury stock) As of December 31, 2018 2,532,004,445 As of March 31, 2018 2,587,213,525 2) Number of treasury stock As of December 31, 2018 166,238,748 As of March 31, 2018 181,809,302 3) Number of weighted average common stock
- utstanding (cumulative for all quarters)
For the nine-month period ended December 31, 2018 2,393,149,067 For the nine-month period ended December 31, 2017 2,436,023,959
Note: The 4,322,928 shares as of December 31, 2018 and the 1,672,702 shares as of March 31, 2018 of KDDI’s stock owned by the executive compensation BIP Trust account and the stock-granting ESOP Trust account are included in the total number of treasury stock.
This quarterly earnings report is not subject to quarterly review procedure. Explanation for appropriate use of forecasts and other notes
- 1. The forward-looking statements such as operational forecasts contained in this statements summary are based on the information
currently available to KDDI and certain assumptions which are regarded as legitimate. Actual results may differ significantly from these forecasts due to various factors. Please refer to P.9 “1. Qualitative Information / Consolidated Financial Statements, etc (3) Explanation Regarding Future Forecast Information of Consolidated Financial Results” under [the Attachment] for the assumptions used and other notes.
- 2. On January 31, 2019, KDDI will hold a financial result briefing for the institutional investors and analysts. Presentation materials
will be webcasted on the same time as the release of this earnings report, and the live presentation and Q&A summary will be also posted on our website immediately after the commencement of the financial result briefing. In addition to the above, KDDI holds the briefing and the presentations on our business for the individual investors timely. For the schedule and details, please check our website.
SLIDE 3 [the Attachment]
Index of the Attachment
- 1. Qualitative Information / Consolidated Financial Statements, etc. ....................................................................... 2
(1) Explanation of Financial Results .................................................................................................................... 2 (2) Explanation of Financial Position................................................................................................................... 8 (3) Explanation Regarding Future Forecast Information of Consolidated Financial Results ............................... 9
- 2. Condensed Interim Consolidated Financial Statements ........................................................................................ 10
(1) Condensed Interim Consolidated Statement of Financial Position ................................................................. 10 (2) Condensed Interim Consolidated Statement of Income ................................................................................. 12 (3) Condensed Interim Consolidated Statement of Comprehensive Income ........................................................ 14 (4) Condensed Interim Consolidated Statement of Changes in Equity ................................................................ 16 (5) Condensed Interim Consolidated Statement of Cash Flows ........................................................................... 18 (6) Going Concern Assumption ........................................................................................................................... 20 (7) Notes to Condensed Interim Consolidated Financial Statements ................................................................... 20
- 1. Reporting entity......................................................................................................................................... 20
- 2. Basis of preparation
................................................................................................................................ 20
- 3. Significant accounting policies ................................................................................................................. 23
- 4. Segment Information
................................................................................................................................. 27
1
SLIDE 4
- 1. Qualitative Information / Consolidated Financial Statements, etc.
(1) Explanation of Financial Results
1) Results Overview
Industry Trends and KDDI’s Position In the Japanese telecommunications market, the competitive environment is becoming more intense, with the services mobile phone operators offer growing more similar, MVNO operators increasingly promoting inexpensive SIM services, and new telecommunications carriers entering the market. Meanwhile, telecommunications carriers are expanding their operations in domains other than telecommunications services to secure new sources of earnings. In addition, the development of technologies such as the Internet of Things (IoT) and artificial intelligence (AI) is ushering in major changes in the business environment in the telecommunications market. In this environment, KDDI is accelerating its transformation into a business that provides customer experience value. In addition to conventional telecommunications services, KDDI is actively advancing new value proposals through “integration of telecommunications and life design” by expanding various life design services. In August 2018, KDDI started providing a package plan including communication fees together with Netflix and Video Pass content usage fees, followed in November by the announcement of provision of “Wowma! au Charge reduction” user charge discount service, which deducts up to 10% from their user charge of the amount users spent shopping on “Wowma!” In Japan, KDDI is working in the telecommunications domain to promote smartphones and tablets and boost its response to the IoT, and aiming to create new customer experience value in coordination with various devices. In addition, we will strive to create sustainable growth in the domestic telecommunications business by maximizing “ID by ARPA” through the “au Pitatto Plan” and “au Flat Plan” payment plans, which are tailored to customers’ data communications usage patterns and expanding the “au Smart Value” set discount for customers who subscribe to au mobile phone/smartphone services as well as fixed-line communications services. Moreover, we will promote “au” and the MVNO business through Group companies. The Group will also work to expand its number of “mobile IDs.” In November 2018, the KDDI was selected for “BRAND OF THE YEAR 2018” by CM Soken Consulting as the No. 1 brand for advertising commercial popularity in fiscal 2018. This is the fourth consecutive year that we have received this prize. Moreover, we will actively utilize various types of technologies, including the 5G next-generation mobile communications system (5G), IoT and AI, which are to be fully implemented going forward, and concentrate on proposing new scenarios for using them. In September 2018, we opened “KDDI DIGITAL GATE,” a business development center for 5G and IoT for creating new business solutions with customers. Furthermore, with regard to 5G, we will work with a wide range of partners to accelerate technology testing and drive the creation of new services leveraging 5G, aiming for the start of services in some areas in 2019. Aiming to achieve “integration of telecommunications and life design,” KDDI will enhance its life design services including commerce, finance, energy, entertainment, and education in the non-telecommunications domain to actively provide new value proposals to customers. We plan to increase transaction amount by growing our commerce business, such as through “Wowma!” and our “au WALLET Card” settlement business. We are also expanding and strengthening the energy business, such as the conversion of ENERES Co., Ltd. into a consolidated subsidiary in December 2018. In addition, we plan to expand the “au Economic Zone” to the maximum by continuing to propose diverse life design services to customers. We will achieve this by the establishment of the finance business, and entry into the education business, among other initiatives. Overseas, in our telecommunications business in emerging countries, KDDI is aiming for further growth with the full rollout of LTE services in the Myanmar telecommunications business, which is jointly operated by consolidated subsidiary KDDI Summit Global Myanmar Co., Ltd. and Myanma Posts & Telecommunications (MPT), the country’s nationally operated telecommunications partner. LTE services have also been rolled out at MobiCom Corporation LLC, which has the largest share of mobile phone subscribers in Mongolia. Furthermore, in addition to its emerging markets business, in data center and other ICT businesses for corporate customers, mainly in Europe, KDDI will continue to reinforce its infrastructure to expand its global business.
2
SLIDE 5
Financial Results For the nine-month period ended December 31, 2018
(Amount unit: Millions of yen)
Nine-month period ended December 31, 2017 Nine-month period ended December 31, 2018 Increase (Decrease) Increase (Decrease)% Operating revenue
3,760,072 3,771,659 11,587 0.3
Cost of sales
2,040,879 2,078,796 37,917 1.9
Gross profit
1,719,194 1,692,863 (26,330) (1.5)
Selling, general and administrative expenses
917,029 878,738 (38,290) (4.2)
Other income and expense (Net)
7,658 5,063 (2,595) (33.9)
Share of profit(loss) of investments accounted for using the equity method
3,948 3,294 (655) (16.6)
Operating income
813,771 822,481 8,710 1.1
Finance income and cost (Net)
(3,459) (4,240) (781) -
Other non-operating profit and loss (Net)
226 3,077 2,851 1,259.7
Profit for the period before income tax
810,539 821,318 10,780 1.3
Income tax
250,257 253,275 3,018 1.2
Profit for the period
560,282 568,044 7,762 1.4
Attributable to owners of the parent
490,558 505,771 15,213 3.1
Attributable to non-controlling interests
69,724 62,273 (7,451) (10.7)
During the nine-month period ended December 31, 2018, operating revenue rose by 0.3% to ¥3,771,659 million, reflecting increases in revenue due to the expansion of the energy business to maximize the “au Economic Zone,” inclusion of AEON Holdings Corporation of Japan (“AEON HD”) in the Group, expansion of “Wowma!” and “au WALLET Market” and expansion of the Life Design Business such as settlement business, as well as increased revenue in the Myanmar business, despite a decline in mobile communications revenues. Operating income increased by 1.1% to ¥822,481 million, mainly due to an increase in sales, despite increases in expenses for the energy business, “Wowma!”, “au WALLET Market,” and the settlement business. Profit for the period attributable to owners of the parent rose by 3.1% to ¥505,771 million, mainly due to the increase in operating income.
3
SLIDE 6 2) Results by Business Segment
Personal Services
The Personal Services segment mainly provides mobile and fixed-line communications services for individual customers in Japan, chiefly under the “au” brand, and sells multi-devices such as various smartphones and tablets. In addition, we provide fixed-line services such as “au HIKARI” brand FTTH services, including in-home Internet, telephone, and TV services, and CATV services. We also provide life design services such as energy and education
- services. Moreover, the KDDI Group organically links Wi-Fi into its multi-network to efficiently create a high
quality social infrastructure and provide a seamless communication environment. During the nine-month period ended December 31, 2018, in the telecommunications domain, we have been working to expand the Group’s number of “mobile IDs” by promoting penetration of the “au Pitatto Plan,” “au Flat Plan” and the “au Flat Plan 25 Netflix Pack” payment plans, which can be selected according to customers’ needs, expanding sales of the “au Smart Value” plan, and promoting the MVNO business through our Group companies. In addition, we started providing “Gakuwari” student discount for customers aged up to 25 and their families in December 2018. Under this service, we offer “au Zero Gakuwari,” which allows customers to use “au Pitatto Plan” from ¥0 per month, as well as several discount services to cater for large volume data communications. Furthermore, UQ Communications Inc. also launched “Fami Zero Gakuwari” in December 2018, offering customers aged up to 18 and their families up to three months of free monthly basic user charges (up to five months for new junior high school and high school student customers). In the non-telecommunications domain, we are promoting “integration of telecommunications and life design” in the commerce, energy, and education businesses, and taking steps to expand life design services and maximize the “au Economic Zone.” We will continue to create new experience value to keep on meeting customers’ expectations. Operating performance in the Personal Services segment for the nine-month period ended December 31, 2018 is described below.
Results For the nine-month period ended December 31, 2018
(Amount unit: Millions of yen) Nine-month period ended December 31, 2017 Nine-month period ended December 31, 2018 Increase (Decrease) Increase (Decrease)% Operating Revenue
2,915,565 2,917,717 2,152 0.1
Operating Income
625,883 619,028 (6,855) (1.1)
During the nine-month period ended December 31, 2018, operating revenue rose by 0.1% to ¥2,917,717 million, mainly due to increases in revenues from the energy business and the inclusion of AEON in the Group, despite a decline in mobile communications revenues. Operating income declined by 1.1% to ¥619,028 million, mainly due to the decrease in mobile communications revenues.
4
SLIDE 7 Life Design Services
In the Life Design segment, KDDI will propose new value and promote “integration of telecommunications and life design,” seeking to expand its customer touchpoints and provide services in multiple forms optimized for use in all areas of customers’ daily lives and life stages. Our various services include commerce, finance, settlement, and entertainment. During the nine-month period ended December 31, 2018, KDDI focused on further expansion of the “au Economic Zone,” as well as promoting initiatives for “edutainment*” and “regional revitalization.” In the commerce business, we started the “Wowma! Furusato Nozei” hometown tax donation for tax reduction service in October 2018. In January 2019 we launched the “Wowma! no au Goriyou Ryoukin Kangen” user charge discount service, which deducts up to 10% of the amount spent by users for shopping on “Wowma!” from their user
- charge. From April 2019, KDDI plans to provide logistics services from Rakuten, Inc. to Wowma! to realize efficient
logistics and shipping services. In the finance business, KDDI launched the defined contribution pension plan service for individual customers, “au no iDeCo,” in October 2018. The service helps KDDI to build long-term contact with customers and provides new experience value by supplying a dedicated smartphone app and WALLET point rewards. Moreover, the number of “au WALLET Credit Card” members exceeded 4 million in November 2018. Through these measures, we plan to maximize the “au Economic Zone.” In initiatives to create new experience value looking ahead to the 5G era, KDDI aims to evolve edutainment by fusing learning opportunities with 5G and IoT through “KidZania,” and has concluded a comprehensive partnership with KidZania and its operator, KCJ Group Co. Ltd. Furthermore, KDDI concluded an agreement with Hakuba Village in December 2018, aiming to expand inbound tourism and promote activities through mutual links and cooperation towards regional revitalization by providing an app, among other means. Going forward, we will continue to leverage the advanced technologies towards realizing sustainable societies by contributing to education, regional revitalization, and other activities. In the energy business, KDDI and Electric Power Development Co., Ltd. concluded a tender offer for the shares of ENERES Co., Ltd. that had been conducted since November 2018 in December 2018 making ENERES Co., Ltd. into a consolidated subsidiary of the Company. Looking ahead, we plan to expand and strengthen the “au Denki” service. Operating performance in the Life Design Services segment for the nine-month period ended December 31, 2018 is described below. * Edutainment: Learning while having fun
Results For the nine-month period ended December 31, 2018 (Amount unit: Millions of yen)
Nine-month period ended December 31, 2017 Nine-month period ended December 31, 2018 Increase (Decrease) Increase (Decrease)% Operating Revenue
387,400 408,541 21,141 5.5
Operating Income
82,207 86,582 4,375 5.3
During the nine-month period ended December 31, 2018, operating revenue rose by 5.5% to ¥ 408,541 million due to increases in revenues from “Wowma!” and “au WALLET Market” and revenues from the settlement business, including “au WALLET prepaid card” and “au WALLET credit card,” in addition to increased revenue from “au Smart Pass Premium.” Due to the operating revenue increase, operating income grew by 5.3% to ¥ 86,582 million, although expenses increased in “Wowma!” and “au WALLET Market” as well as the settlement business. * The name of segment of “Value” was changed to “Life Design” from three-month period ended June 30, 2018.
5
SLIDE 8
Business Services
In the Business Services segment, we provide smartphones, tablets and other mobile devices as well as diverse solutions such as networks, applications and cloud services, to customers ranging from small and medium-sized to large companies. For small and medium-sized corporate customers, our consolidated subsidiary, the KDDI MATOMETE OFFICE GROUP is building a regional support network offering close contact throughout Japan. In the third quarter of the fiscal year ending March 2019, the construction of Global Communications Platform which Toyota Motor Corporation and KDDI jointly announced in 2016 progressed as planned. We announced the collaboration with AT&T Communications that will enable 4G LTE connectivity for Toyota and Lexus vehicles starting from 2020 model year in the fall of 2019, across all 50 states in the United States. *1 We also started trial testing of smart lockers in collaboration with Alpha Locker System Co., Ltd. and SEIBU RAILWAY Co, Ltd in December 2018. The trial will seek to solve time restrictions on working people by launching a smart locker, “RakutoruTM,” that allows them to access products during a time period that fits in with their working styles. Furthermore, in regional revitalization efforts leveraging ICT, KDDI will seek to solve regional issues by promoting collaboration with local governments. For example, we concluded an agreement with Higashimatsushima City in Miyagi Prefecture in November 2018, aimed at promoting projects related to SDGs FutureCity*2 that utilize telecommunications technology to make fishing and agriculture operations more efficient, among other initiatives. This was followed in December 2018 by the conclusion of an agreement between industry, academia, and government with Obama City, Fukui Prefecture and Fukui Prefectural University, regarding methodology, R&D, and sale of special products in the mackerel farming business, as well as promoting measures to attract tourists. Looking ahead, we will contribute even more to the development and expansion of our corporate customers’ businesses, and we will work on business innovation with the goal of being our customers’ preferred choice as a true business partner. Operating performance in the Business Services segment for the nine-month period ended December 31, 2018 is described below.
*1 Announced in conjunction with the Consumer Electronics Show (CES) held in Las Vegas on January 7, 2019 United States local time *2 Cities and regions attempting to promote basic and comprehensive initiatives in line with the principles of the SDGs, that have been selected for their particularly high potential for realizing sustainable development through new value creation in the three aspects of economy, society, and the environment <http://www.city.higashimatsushima.miyagi.jp/index.cfm/22,12588,71,html>
Results For the nine-month period ended December 31, 2018
(Amount unit: Millions of yen) Nine-month period ended December 31, 2017 Nine-month period ended December 31, 2018 Increase (Decrease) Increase (Decrease)% Operating Revenue
543,622 582,283 38,661 7.1
Operating Income
72,073 82,448 10,375 14.4
During the nine-month period ended December 31, 2018, operating revenue increased by 7.1% to ¥ 582,283 million, mainly due to increases in solution sales and handset sales revenues. Operating income rose by 14.4% year on year to ¥ 82,448 million, mainly due to an increase in operating revenues, despite increases in solution equipment costs and handset procurement costs.
6
SLIDE 9 Global Services
The Global Services segment is working aggressively to expand the consumer businesses in Myanmar, Mongolia, and other overseas countries, and to provide ICT solutions to corporate customers, including data centers, network, cloud, and IoT, aiming to contribute to their business development and expansion. During the nine-month period ended December 31, 2018, in the telecommunications business in Myanmar we launched an e-book service in December 2018 and worked to enhance entertainment services such as video, music, and games amid growing data communication usage. We are also continuing to strengthen the 4G LTE network, and are contributing to further promotion of usage by customers with the launch of new fee packages in November 2018. In the Mongolian telecommunications business, KDDI’s consolidated subsidiary MobiCom Corporation LLC (“MobiCom”) is promoting initiatives to respond to various kinds of data communication demand. As part of this, MobiCom has increased the volume of data package allowances and started a promotional campaign for a package
- ffering unlimited use of SNS, games, and video.
Furthermore, MobiCom has been selected as one of the top 10 ranking companies in the 2018 Entrepreneur Award held by the Mongolian Chamber of Commerce again after having been selected in 2017. In the ICT solutions business, KDDI’s consolidated subsidiaries KDDI America and KDDI Europe concluded reseller agreements with leading robotic process automation (RPA) software companies UiPath Inc. and UiPath SRL in October 2018 for their RPA platform in Europe and the United States. With this step, we have established a global provision system in conjunction with existing agreements covering Southeast Asia and East Asia. Operating performance in the Global Services segment for the nine-month period ended December 31, 2018 is described below.
Results For the nine-month period ended December 31, 2018
(Amount unit: Millions of yen) Nine-month period ended December 31, 2017 Nine-month period ended December 31, 2018 Increase (Decrease) Increase (Decrease)% Operating Revenue
191,721 164,472 (27,250) (14.2)
Operating Income
25,108 30,266 5,157 20.5
During the nine-month period ended December 31, 2018, operating revenue decreased by 14.2 % to ¥ 164,472
- million. This reflected the impact of decreased revenue resulting from restructured unprofitable businesses,
meanwhile revenue in the Myanmar and “TELEHOUSE” data center businesses increased. Operating income increased by 20.5 % to ¥ 30,266 million, reflecting the solid increase in operating revenue in the Myanmar and “TELEHOUSE” data center businesses and decrease in the costs of restructured unprofitable businesses. As for KDDI Summit Global Singapore Pte. Ltd., due to the environment encompassing local accounting in the areas where subsidiaries KDDI Summit Global Myanmar Co., Ltd. are located, preliminary results were not
- btained by the Company’s closing date for subsidiary reporting, and reporting periods were not unified. However,
due to improvement for financial reporting in the first quarter of the fiscal year ending March 31, 2019, the reporting periods are unified.
* Company and product names mentioned in (1) Explanation of Financial Results are registered trademarks or trademarks of their respective companies.
7
SLIDE 10 (2) Explanation of Financial Position
(Amount unit: Millions of yen) As of March 31, 2018 As of December 31, 2018 Increase (Decrease) Increase (Decrease)% Non-current assets Current assets
4,423,306 2,151,249 4,820,237 2,336,721 396,931 185,472 9.0 8.6
Total assets
6,574,555 7,156,958 582,403 8.9
Non-current liabilities Current liabilities
1,005,498 1,437,800 1,203,585 1,433,127 198,088 (4,673) 19.7 (0.3)
Total liabilities
2,443,298 2,636,713 193,415 7.9
Total equity
4,131,257 4,520,245 388,988 9.4 (Assets)
Total assets amounted to ¥7,156,958 million as of December 31, 2018, up ¥582,403 million from their level on March 31, 2018. Although deferred tax assets and other non-current assets decreased, contract costs and trade
and other receivables increased. (Liabilities)
Total liabilities amounted to ¥2,636,713 million as of December 31, 2018, up ¥193,415 million from March 31,
- 2018. Although other non-current liabilities, other current liabilities decreased, borrowings and bonds payable,
contract liabilities increased.
(Equity) Total equity amounted to ¥4,520,245million, mainly due to an increase in retained earning. As a result, the ratio of
equity attributable to owners of the parent to total assets remained at 57.4% as of December 31, 2018, the same level as of March 31, 2018.
8
SLIDE 11
- 2. Consolidated Cash Flows
(Amount unit: Millions of yen) Nine-month period ended December 31, 2017 Nine-month period ended December 31, 2018 Increase (Decrease) Net cash provided by (used in) operating activities
760,159 719,384 (40,775)
Net cash provided by (used in) investing activities
(404,140) (571,354) (167,214)
Free cash flows (Note)
356,019 148,030 (207,989)
Net cash provided by (used in) financing activities
(401,399) (156,683) 244,716
Effect of exchange rate changes on cash and cash equivalents
495 (547) (1,041)
Net increase (decrease) in cash and cash equivalents
(44,885) (9,200) 35,686
Cash and cash equivalents at the beginning of the period
226,607 200,834 (25,773)
Cash and cash equivalents at the end of period
181,722 191,634 9,912
Note: Free cash flows are calculated as the sum of “net cash provided by (used in) operating activities” and “net cash provided by (used in) investing activities.”
Operating activities provided net cash of ¥719,384 million. This includes ¥821,318 million of profit for the period before income tax, ¥420,625 million of depreciation and amortization, ¥286,136 million of income tax paid and ¥175,816 million of increase in trade and other receivables. Investing activities used net cash of ¥571,354 million. This includes ¥295,819 million of purchases of property, plant and equipment, ¥166,710 million of purchases of intangible assets and ¥82,491 million of purchases of stocks of associates. Financial activities used net cash of ¥156,683 million. This includes ¥237,391 million of net increase of short-term borrowings, ¥310,000 million of proceeds from issuance of bonds and long-term borrowings, ¥300,640 million of payments from redemption of bonds and repayments of long-term borrowings, ¥226,734 million of cash dividends paid and ¥110,680 million of payments from purchase of treasury stock. As a result, the total amount of cash and cash equivalents as of December 31, 2018 decreased by ¥9,200 million from March 31, 2018 to ¥191,634 million.
(3) Explanation Regarding Future Forecast Information of Consolidated Financial Results
The estimated consolidated financial results for the year ending March 31, 2019 for full-year basis disclosed in the Financial Statements Summary for the year ended March 31, 2018 (disclosed on May 10, 2018) were as follows; Operating Revenue: ¥5,150,000 million, Operating Income: ¥1,020,000 million, Profit for the year attributable to
- wners of the parent: ¥620,000 million. There is no change to these figures.
9
SLIDE 12
- 2. Condensed Interim Consolidated Financial Statements
(1) Condensed Interim Consolidated Statement of Financial Position
(Unit: Millions of yen) As of March 31, 2018 As of December 31, 2018 Assets Non-current assets : Property, plant and equipment 2,437,196 2,498,928 Goodwill 526,601 545,226 Intangible assets 953,106 947,964 Investments accounted for using the equity method 98,192 173,084 Other long-term financial assets 236,684 249,626 Deferred tax assets 106,050 10,732 Contract costs - 384,713 Other non-current assets 65,477 9,964 Total non-current assets 4,423,306 4,820,237 Current assets : Inventories 89,207 108,798 Trade and other receivables 1,695,403 1,870,005 Other short-term financial assets 30,173 38,048 Income tax receivables 2,101 4,342 Other current assets 133,531 123,895 Cash and cash equivalents 200,834 191,634 Total current assets 2,151,249 2,336,721 Total assets 6,574,555 7,156,958
10
SLIDE 13
(Unit: Millions of yen) As of March 31, 2018 As of December 31, 2018 Liabilities and Equity Liabilities Non-current liabilities: Borrowings and bonds payable 704,278 898,855 Other long-term financial liabilities 68,478 66,182 Retirement benefit liabilities 12,010 9,718 Deferred tax liabilities 80,298 107,738 Provisions 10,754 34,641 Contract liabilities - 79,552 Other non-current liabilities 129,679 6,898 Total non-current liabilities 1,005,498 1,203,585 Current liabilities: Borrowings and bonds payable 329,559 395,973 Trade and other payables 610,726 570,194 Other short-term financial liabilities 24,717 26,591 Income taxes payables 143,635 85,612 Provisions 31,231 32,134 Contract liabilities - 116,665 Other current liabilities 297,932 205,959 Total current liabilities 1,437,800 1,433,127 Total liabilities 2,443,298 2,636,713 Equity Equity attributable to owners of the parent Common stock 141,852 141,852 Capital surplus 289,578 284,212 Treasury stock (338,254) (344,408) Retained earnings 3,672,344 4,034,715 Accumulated other comprehensive income 8,183 (7,156) Total equity attributable to owners of the parent 3,773,703 4,109,214 Non-controlling interests 357,554 411,031 Total equity 4,131,257 4,520,245 Total liabilities and equity 6,574,555 7,156,958
11
SLIDE 14
(2) Condensed Interim Consolidated Statement of Income
(Unit: Millions of yen) For the nine-month period ended December 31, 2017 For the nine-month period ended December 31, 2018 Operating revenue 3,760,072 3,771,659 Cost of sales 2,040,879 2,078,796 Gross profit 1,719,194 1,692,863 Selling, general and administrative expenses 917,029 878,738 Other income 8,986 6,805 Other expense 1,328 1,743 Share of profit of investments accounted for using the equity method 3,948 3,294 Operating income 813,771 822,481 Finance income 4,207 3,274 Finance cost 7,666 226 7,514 3,077 Other non-operating profit and loss Profit for the period before income tax 810,539 821,318 Income tax 250,257 253,275 Profit for the period 560,282 568,044 Profit for the period attributable to: Owners of the parent 490,558 505,771 Non-controlling interests 69,724 62,273 Profit for the period 560,282 568,044 Earnings per share attributable to owners of the parent Basic earnings per share (yen) 201.38 211.34 Diluted earnings per share (yen) 201.33 211.31
12
SLIDE 15
(Unit: Millions of yen) For the three-month period ended December 31, 2017 For the three-month period ended December 31, 2018 Operating revenue 1,344,003 1,309,390 Cost of sales 759,641 758,704 Gross profit 584,362 550,686 Selling, general and administrative expenses 316,850 292,697 Other income 2,794 2,312 Other expense 393 719 Share of profit of investments accounted for using the equity method 1,322 1,708 Operating income 271,235 261,289 Finance income 1,018 1,221 Finance cost 2,496 4,558 Other non-operating profit and loss 226 2,999 Profit for the period before income tax 269,984 260,951 Income tax 83,343 79,474 Profit for the period 186,641 181,477 Profit for the period attributable to: Owners of the parent 161,114 160,295 Non-controlling interests 25,527 21,182 Profit for the period 186,641 181,477 Earnings per share attributable to owners of the parent Basic earnings per share (yen) 66.46 67.42 Diluted earnings per share (yen) 66.44 67.41
13
SLIDE 16 (3) Condensed Interim Consolidated Statement of Comprehensive Income (Unit: Millions of yen) For the nine-month period ended December 31, 2017 For the nine-month period ended December 31, 2018 Profit for the period 560,282 568,044 Other comprehensive income Items that will not be transferred subsequently to profit
Changes measured in fair value of financial assets through other comprehensive income 13,783 (7,516) Share of other comprehensive income of investments accounted for using the equity method (375) (1,478) Total 13,407 (8,994) Items that may be subsequently reclassified to profit or loss Changes in fair value of cash flow hedge 1,049 112 Translation differences on foreign operations 5,268 (7,114) Share of other comprehensive income of investments accounted for using the equity method (86) 67 Total 6,230 (6,936) Total other comprehensive income 19,638 (15,929) Total comprehensive income for the period 579,920 552,114 Total comprehensive income for the period attributable to: Owners of the parent 510,499 490,737 Non-controlling interests 69,421 61,378 Total 579,920 552,114 (Note) Items in the statement above are presented net of tax.
14
SLIDE 17 (Unit: Millions of yen) For the three-month period ended December 31, 2017 For the three-month period ended December 31, 2018 Profit for the period 186,641 181,477 Other comprehensive income Items that will not be transferred subsequently to profit
Changes measured in fair value of financial assets through other comprehensive income 6,712 (10,868) Share of other comprehensive income of investments accounted for using the equity method (41) (458) Total 6,672 (11,327) Items that may be subsequently reclassified to profit or loss Changes in fair value of cash flow hedge 222 (754) Translation differences on foreign operations 1,979 (8,036) Share of other comprehensive income of investments accounted for using the equity method 130 236 Total 2,331 (8,554) Total other comprehensive income 9,002 (19,881) Total comprehensive income for the period 195,643 161,596 Total comprehensive income for the period attributable to: Owners of the parent 169,730 142,652 Non-controlling interests 25,914 18,944 Total 195,643 161,596 (Note) Items in the statement above are presented net of tax.
15
SLIDE 18 (4) Condensed Interim Consolidated Statement of Changes in Equity
For the nine-month period ended December 31, 2017 (Unit: Millions of yen) Equity attributable to owners of the parent Common stock Capital surplus Treasury stock Retained earnings
Accumulated
comprehensive income
Total
Non- controlling interests
Total equity As of April 1, 2017 141,852 298,046 (237,014) 3,354,140 (2,601) 3,554,423 294,710 3,849,133 Comprehensive income Profit for the period - - - 490,558 - 490,558 69,724 560,282 Other comprehensive income - - - - 19,941 19,941 (303) 19,638 Total comprehensive income - - - 490,558 19,941 510,499 69,421 579,920 Transactions with owners and
Cash dividends - - - (219,703) - (219,703) (47,359) (267,062) Transfer of accumulated
income to retained earnings - - - 213 (213) - - - Purchase and disposal of treasury stock - (29) (100,000) - - (100,029) - (100,029) Retirement of treasury stock - (9,074) 48,709 (39,635) - - - - Changes due to business combination - - - - - - 4,706 4,706 Changes in interests in subsidiaries - (638) - - - (638) 15,427 14,790 Other - 505 50 - - 556 (502) 53 Total transactions with
transactions - (9,235) (51,240) (259,124) (213) (319,813) (27,728) (347,542) As of December 31, 2017 141,852 288,810 (288,255) 3,585,574 17,127 3,745,109 336,403 4,081,511
16
SLIDE 19 For the nine-month period ended December 31, 2018 (Unit: Millions of yen) Equity attributable to owners of the parent Common stock Capital surplus Treasury stock Retained earnings
Accumulated
comprehensive income
Total
Non- controlling interests
Total equity As of April 1, 2018 141,852 289,578 (338,254) 3,672,344 8,183 3,773,703 357,554 4,131,257 Cumulative effects of changes in accounting policies - - - 187,468 - 187,468 29,302 216,770 Restated balance 141,852 289,578 (338,254) 3,859,812 8,183 3,961,171 386,856 4,348,027 Comprehensive income Profit for the period - - - 505,771 - 505,771 62,273 568,044 Other comprehensive income - - - - (15,035) (15,035) (895) (15,929) Total comprehensive income - - - 505,771 (15,035) 490,737 61,378 552,114 Transactions with owners and
Cash dividends - - - (227,937) - (227,937) (33,679) (261,616) Transfer of accumulated
income to retained earnings - - - 304 (304) - - - Purchase and disposal of treasury stock - (60) (110,680) - - (110,741) - (110,741) Retirement of treasury stock - - 103,235 (103,235) - - - - Changes due to business combination - - - - - - 2,514 2,514 Changes in interests in subsidiaries - (4,903) - - - (4,903) (6,038) (10,941) Other - (403) 1,291 - - 888 - 888 Total transactions with
transactions - (5,367) (6,155) (330,868) (304) (342,694) (37,203) (379,896) As of December 31, 2018 141,852 284,212 (344,408) 4,034,715 (7,156) 4,109,214 411,031 4,520,245
17
SLIDE 20
(5) Condensed Interim Consolidated Statement of Cash Flows
(Unit: Millions of yen) For the nine-month period ended December 31, 2017 For the nine-month period ended December 31, 2018 Cash flows from operating activities Profit for the period before income tax 810,539 821,318 Depreciation and amortization 411,266 420,625 Share of (profit) loss of investments accounted for using the equity method (3,948) (3,294) Loss (gain) on sales of non-current assets (147) 273 Interest and dividends income (3,233) (3,273) Interest expenses 7,423 6,761 (Increase) decrease in trade and other receivables (142,024) (175,816) Increase (decrease) in trade and other payables 36,940 (18,888) (Increase) decrease in inventories (28,751) (19,446) Increase (decrease) in retirement benefit liabilities (1,618) (2,292) Other (31,028) (18,704) Cash generated from operations 1,055,418 1,007,264 Interest and dividends received 5,996 5,896 Interest paid (14,914) (7,641) Income tax paid (286,341) (286,136) Net cash provided by (used in) operating activities 760,159 719,384
18
SLIDE 21
(Unit: Millions of yen) For the nine-month period ended December 31, 2017 For the nine-month period ended December 31, 2018 Cash flows from investing activities Purchases of property, plant and equipment (256,762) (295,819) Proceeds from sales of property, plant and equipment 926 727 Purchases of intangible assets (129,278) (166,710) Purchases of other financial assets (5,240) (10,093) Proceeds from sales/redemption of other financial assets 1,243 545 Acquisitions of control over subsidiaries (14,754) (13,274) Purchases of stocks of associates (1,682) (82,491) Proceeds from sales of stocks of subsidiaries and associates 1,896 102 Other (489) (4,341) Net cash provided by (used in) investing activities (404,140) (571,354) Cash flows from financing activities Net increase (decrease) of short-term borrowings 23,575 237,391 Proceeds from issuance of bonds and long-term borrowings 95,000 310,000 Payments from redemption of bonds and repayments of long-term borrowings (55,911) (300,640) Repayments of lease obligations (20,444) (21,029) Payments from purchase of subsidiaries’equity from non-controlling interests (70) (10,903) Proceeds from stock issuance to non-controlling interests 19,006 84 Payments from purchase of treasury stock (100,000) (110,680) Cash dividends paid (218,878) (226,734) Cash dividends paid to non-controlling interests (48,550) (34,171) Purchase of debt instruments (Note) (95,000) - Other (127) (0) Net cash provided by (used in) financing activities (401,399) (156,683) Effect of exchange rate changes on cash and cash equivalents 495 (547) Net increase (decrease) in cash and cash equivalents (44,885) (9,200) Cash and cash equivalents at the beginning of the period 226,607 200,834 Cash and cash equivalents at the end of the period 181,722 191,634 (Note) During the nine-month period ended December 31, 2017, KDDI purchased the beneficiary right to preferred shares issued by a subsidiary of the KDDI Group (These shares are treated as financial liabilities because the issuer has an obligation to deliver cash to holders of preference shares).
19
SLIDE 22 (6) Going Concern Assumption
None
(7) Notes to Condensed Interim Consolidated Financial Statements
KDDI Corporation (“the Company”) was established as a limited company in accordance with Japanese Company Act. The location of the Company is Japan and the registered address of its headquarter is 2-3-2, Nishishinjuku, Shinjuku-ku, Tokyo, Japan. The Company’s condensed interim consolidated financial statements as of and for the nine-month period ended December 31, 2018 comprise the Company and its consolidated subsidiaries (“the Group”) and the Group’s interests in associates and joint ventures. The Company is the ultimate parent company of the Group. The Group’s major business and activities are “Personal Services”, “Life Design Services”, “Business Services” and “Global Services.” For the details, please refer to “(1) Outline of reporting segments” of “Note 4. Segment information.”
(1) Compliance of condensed interim consolidated financial statements with IFRSs The Group’s condensed interim consolidated financial statements have been prepared in accordance with IAS 34 of IFRSs as prescribed in Article 93 of Ordinance on Terminology, Forms and Preparation Methods of Quarterly Consolidated Financial Statements (Cabinet Office Ordinance No.64 of 2007), hereinafter referred to as “Ordinance on Quarterly Consolidated Financial Statements” as they satisfy the requirement of a “specific company” set forth in Article 1-2 of Ordinance on Quarterly Consolidated Financial Statements. The condensed interim consolidated financial statements, which do not contain all the information required in annual consolidated financial statements, should be read in conjunction with the annual consolidated financial statements for the previous fiscal year ended March 31, 2018. (2) Basis of measurement The Group’s condensed interim consolidated financial statements have been prepared under the historical cost basis except for the following significant items on the condensed interim consolidated statement of financial position:
- Derivative assets and derivative liabilities (measured at fair value)
- Financial assets or financial liabilities at fair value through profit or loss
- Financial assets at fair value through other comprehensive income
20
SLIDE 23
- Assets and liabilities related to defined benefit plan (measured at the present value of the defined benefit
- bligations, net of the fair value of the plan asset)
(3) Presentation currency and unit of currency The Group’s condensed interim consolidated financial statements are presented in Japanese yen, which is the currency of the primary economic environment of the Company’s business activities, and are rounded to the nearest million yen. (4) Use of estimates and judgement The preparation of condensed interim consolidated financial statements in accordance with IFRSs requires management to make judgments, estimates and assumptions that affect the application of accounting policies and the reported amounts of assets and liabilities, income and expenses. The estimates and assumptions are based on the management’s best judgments, through their evaluation of various factors that were considered reasonable as of the period-end, based on historical experience and by collecting available information. By the nature of the estimates or assumptions, however, actual results may differ from those estimates and assumptions. The estimates and assumptions are reviewed on an ongoing basis. The effect of adjusting accounting estimates is recognized in the fiscal year in which the estimates are adjusted and in the subsequent fiscal years. The judgments, estimates and assumptions that have significant impact on the amount in the condensed interim consolidated financial statements as of and for the nine-month period ended December 31, 2018 are consistent with those described in the annual consolidated financial statements for the previous fiscal year ended March 31, 2018 in principle. (5) Application of new standards and interpretations The Group has applied IFRS 15 “Revenue from Contracts with Customers.” In line with the transitional measures for IFRS 15, the new standards are applied retroactively and the cumulative impact from the start of application is recognized as an adjustment to the balance of retained earnings at the start of the fiscal year ending March 31, 2019. Details regarding the impact of this change in accounting policy are presented in “Note 3. Significant Accounting Policies.”
21
SLIDE 24
(6) Standards not yet adopted The following new standards and amendments announced by the approval date of the condensed interim consolidated financial statements are not mandatory as of December 31, 2018. They have not been early adopted by the Group. Standard The title of Standard Mandatory adoption (from the fiscal year beginning) To be adopted by the Group from Outline of new standards and amendments IFRS16 Lease January 1, 2019 fiscal year ending March 31, 2020 IFRS16 describes that revision of current accounting standard for lease and disclosure. Specifically, IFRS 16 introduces a single lessee accounting model and requires a lessee to recognize its right to use the underlying leased asset and a lease liability representing its obligation to make lease payments for all leases with a term of more than 12 months as principal. All the standards and amendments above will be reflected to the condensed interim consolidated financial statements for the relevant fiscal year described above. The Company is currently evaluating the impact of the application and estimate is currently not available.
22
SLIDE 25
- 3. Significant accounting policies
With the exception of the following, the significant accounting policies applied in this condensed interim consolidated financial statements for the nine-month period ended December 31, 2018, are consistent with those of the annual financial statements, as described in the consolidated financial statements for the previous fiscal year ended March 31, 2018, except that income tax expenses on condensed interim consolidated statement of income are calculated based on the estimated average annual effective income tax rate. (1) Application of IFRS15 Impact of applying new accounting standard The Group has applied the following standard from the three-month period ended June 30, 2018. IFRS Newly established contents IFRS 15 Revenue from contracts with customers (Newly established in May 2014) New standard for accounting procedure and presentation regarding revenue recognition. The Group has applied IFRS 15 in accordance with the transition elections available, and therefore retrospectively recognized the cumulative effect of initially applying the standard as an adjustment to the
- pening balance of retained earnings as of April 1, 2018.
In accordance with IFRS 15, excluding such as interest and dividend recognized in accordance with IFRS 9, insurance revenues recognized in accordance with IFRS 4 and lease revenues recognized in accordance with IAS 17, revenues are recognized upon transfer of promised goods or services to customers in amounts that reflect the consideration to which the Group expect to be entitled in exchange for those goods or services based on the following five step approach: Step 1: Identify the contracts with customers Step 2: Identify the performance obligations in the contract Step 3: Determine the transaction price Step 4: Allocate the transaction price to the performance obligations in the contract Step 5: Recognize revenue when (or as) the entity satisfies a performance obligation We recognize the incremental costs for obtaining contracts with customers and the costs incurred in fulfilling a contract with a customer as an asset if those costs are expected to be recoverable. The incremental costs for obtaining contracts are those costs that the Group incurs to obtain a contract with a customer that it would not have incurred if the contract had not been obtained. Depending on the business model applied, the new standards affect the following issues in particular.
23
SLIDE 26
- In the case where the Group sells mobile handsets to customers and simultaneously enters into a
communications service contracts with the customers, accounting might change as a result of combination
- f contracts and allocating the transaction prices to performance obligation.
- Under IFRS 15, expenses for sales commissions are capitalized and recognized over the estimated
customer retention period. On first-time application of the standard, both total assets and equity increase due to the capitalization of contract assets.
- Deferral, i.e., later recognition of revenue in cases where “material rights” are granted, such as offering
additional discounts for future purchases of further products. In summary, the following adjustments has been made to the amounts recognized in the Condensed Interim Consolidated Statement of Financial Position at the date of initial application (1 Apr 2018) and at the end of the comparative period (31 Mar 2018). (Unit: Millions of yen) IAS 18 carrying amount 31 Mar 2018 Reclassification Remeasurements IFRS 15 carrying amount 1 Apr 2018 Retained earnings effect 1 Apr 2018 Goodwill 526,601 - (5,633) 520,967 (5,633) Deferred tax assets 106,050 - (73,425) 32,625 (73,425) Contract costs - 84,868 275,984 360,851 275,984 Other non-current assets 65,477 (56,358) - 9,119 - Other current assets 133,531 (28,510) - 105,021 - Deferred tax liabilities 80,298 - 26,768 107,066 (26,768) Contract liabilities - 243,655 (46,612) 197,043 46,612 Other non-current liabilities 129,679 (123,275) - 6,404 - Other current liabilities 297,932 (120,379) - 177,553 - Non-controlling interests 357,554 - 29,302 386,856 (29,302)
24
SLIDE 27
A reconciliation of the adjustments from the application of IFRS15 relative to IAS18 on the impacted financial statement line items in Condensed Interim Consolidated Statement of Income and Condensed Interim Consolidated Statement of Financial Position are as follows. (Unit: Millions of yen) IAS 18 carrying amount IFRS 15 carrying amount
Condensed Interim Consolidated Statement of Income
Operating revenue 3,786,484 3,771,659 Cost of sales 2,091,890 2,078,796 Gross profit 1,694,594 1,692,863 Selling, general and administrative expenses 907,528 878,738 Operating income 795,422 822,481 Profit for the period 550,549 568,044 Owners of the parent 490,119 505,771 Non-controlling interests 60,430 62,273 Basic earnings per share (yen) 204.80 211.34 Diluted earnings per share (yen) 204.77 211.31
Condensed Interim Consolidated Statement of Financial Position
Goodwill 550,859 545,226 Deferred tax assets 92,422 10,732 Contract costs - 384,713 Other non-current assets 64,134 9,964 Other current assets 151,099 123,895 Deferred tax liabilities 79,672 107,738 Contract liabilities - 196,218 Other non-current liabilities 130,064 6,898 Other current liabilities 325,328 205,959 Retained earnings 3,831,595 4,034,715 Non-controlling interests 379,885 411,031
25
SLIDE 28 (2) Unification of reporting period The consolidated financial statements include the financial statements of subsidiaries whose closing dates are different from that of the Company. For the preparation of the consolidated financial statements, such subsidiaries prepare financial statements based on the provisional accounts as of the Company’s closing date. As for KDDI Summit Global Singapore Pte. DDI , due to the environment encompassing local accounting in the areas where subsidiaries KDDI Summit Global Myanmar Co., Ltd. are located, preliminary results were not obtained by the Company’s closing date for subsidiary reporting, and reporting periods were not
- unified. However, due to improvement for financial reporting in the first quarter of the fiscal year ending
March 31, 2019, the reporting periods are unified.
26
SLIDE 29
(1) Outline of reporting segments The reporting segments of the Group are units of the Group of which separate financial information is available, and which are periodically monitored for the board of directors to determine the allocation of the business resource and evaluate the performance results. The Group has four reportable segments: Personal Services segment, Life Design Services segment, Business Services segment and Global Services segment. The Group’s reportable segments are the same as its business segments. Also, the name of segment of “Value” was changed to “Life Design” from three-month period ended June 30, 2018 due to the changes in organization of the company as of April 1, 2018. “Personal” provides services for individual customers in Japan. These include mobile communications services, device sales such as smartphones and tablets, FTTH services, and CATV services, as well as business such as non-telecommunications including product sales, energy and education. “Life Design” includes the commerce business, financing business, settlement services, and contents services such as video, music, and information distribution. “Business” provides services for corporate customers in Japan. These include mobile and fixed-line communications services and device sales, as well as the solutions business, such as network, application, and cloud services. “Global” provides services for customers overseas. These include mobile communications services for individual customers and ICT solution services for corporate customers, such as data centers. In the three-month period ended June 30, 2018, the reporting segment for the business operations of the consolidated subsidiary ENERES Co., Ltd. * was transferred from “Others” to “Life Design” by the Group’s
Accordingly, the segment information for the nine-month period ended December 31, 2017 has been presented based on the segment classification after this change.
* ENERES Co., Ltd. be made into consolidated subsidiary of the Company from the equity-method affiliate company in December 2018. 27
SLIDE 30 (2) Calculation method of revenue, income or loss, assets and other items by reporting segment Accounting treatment of reported business segments is consistent with “Note 3. Significant accounting policies” stated in the annual consolidated financial statements for the previous fiscal year ended March 31, 2018. Income of the reporting segments is based on the operating income. Inter segment transaction price is determined based on the price by arm’s length transactions or gross costs after price negotiation. Assets and liabilities are not allocated to reporting segments. (3) Information related to the amount of revenue, income or loss and other items by reporting segment The Group’s segment information is as follows: For the nine-month period ended December 31, 2017 (Unit: Millions of yen) Reporting segment Other (Note 1) Total Adjustment (Note 2) Amounts
consolidated financial statements Personal Life Design Business Global Sub- total Revenue Revenue from external customers 2,837,891 300,494 426,063 170,569 3,735,016 25,056 3,760,072 - 3,760,072 Inter-segment revenue
77,674 86,906 117,559 21,152 303,291 49,554 352,846 (352,846) - Total 2,915,565 387,400 543,622 191,721 4,038,308 74,610 4,112,918 (352,846) 3,760,072 Segment income 625,883 82,207 72,073 25,108 805,272 8,900 814,171 (400) 813,771 Finance income and finance cost (Net) (3,459) Other non-operating profit and loss (Net) 226 Profit for the period before income tax 810,539 (Note 1) Business segment “Other” does not constitute reporting segments, and includes construction and maintenance of facilities, and research and development of leading-edge technology. (Note 2) Adjustment of segment income shows the elimination of inter-segment transactions.
28
SLIDE 31 For the nine-month period ended December 31, 2018 (Unit: Millions of yen) Reporting segment Other (Note 1) Total Adjustment (Note 2) Amounts
consolidated financial statements Personal Life Design Business Global (Note 3) Sub- total Revenue Revenue from external customers 2,840,438 315,747 451,248 144,118 3,751,551 20,108 3,771,659 - 3,771,659 Inter-segment revenue
77,279 92,794 131,036 20,353 321,461 48,991 370,452 (370,452) - Total 2,917,717 408,541 582,283 164,472 4,073,012 69,099 4,142,111 (370,452) 3,771,659 Segment income 619,028 86,582 82,448 30,266 818,323 4,231 822,554 (73) 822,481 Finance income and finance cost (Net) (4,240) Other non-operating profit and loss (Net) 3,077 Profit for the period before income tax 821,318 (Note 1) Business segment “Other” does not constitute reporting segments, and includes construction and maintenance of facilities, and research and development of leading-edge technology. (Note 2) Adjustment of segment income shows the elimination of inter-segment transactions. (Note 3) As for KDDI Summit Global Singapore Pte. Ltd., due to the environment encompassing local accounting in the areas where subsidiaries KDDI Summit Global Myanmar Co., Ltd. are located, preliminary results were not obtained by the Company’s closing date for subsidiary reporting, and reporting periods were not unified. However, due to improvement for financial reporting in the first quarter of the fiscal year ending March 31, 2019, the reporting periods are unified.
29
SLIDE 32 For the three-month period ended December 31, 2017 (Unit: Millions of yen) Reporting segment Other (Note 1) Total Adjustment (Note 2) Amounts
consolidated financial statements Personal Life Design Business Global Sub- total Revenue Revenue from external customers 1,025,622 108,943 145,109 53,431 1,333,105 10,898 1,344,003 - 1,344,003 Inter-segment revenue
26,768 31,639 39,476 7,277 105,160 17,066 122,226 (122,226) - Total 1,052,390 140,582 184,584 60,708 1,438,265 27,964 1,466,229 (122,226) 1,344,003 Segment income(loss) 203,792 31,101 23,692 9,101 267,686 3,504 271,190 45 271,235 Finance income and finance cost (Net) (1,478) Other non-operating profit and loss (Net) 226 Profit for the period before income tax 269,984 (Note 1) Business segment “Other” does not constitute reporting segments, and includes construction and maintenance of facilities, and research and development of leading-edge technology. (Note 2) Adjustment of segment income shows the elimination of inter-segment transactions.
30
SLIDE 33 For the three-month period ended December 31, 2018 (Unit: Millions of yen) Reporting segment Other (Note 1) Total Adjustment (Note 2) Amounts
consolidated financial statements Personal Life Design Business Global (Note 3) Sub- total Revenue Revenue from external customers 993,283 118,676 150,908 39,516 1,302,383 7,007 1,309,390 - 1,309,390 Inter-segment revenue
26,264 31,294 47,366 6,946 111,870 16,941 128,811 (128,811) - Total 1,019,547 149,970 198,275 46,462 1,414,253 23,948 1,438,202 (128,811) 1,309,390 Segment income(loss) 192,310 31,865 27,851 7,609 259,636 1,763 261,398 (109) 261,289 Finance income and finance cost (Net) (3,338) Other non-operating profit and loss (Net) 2,999 Profit for the period before income tax 260,951 (Note 1) Business segment “Other” does not constitute reporting segments, and includes construction and maintenance of facilities, and research and development of leading-edge technology. (Note 2) Adjustment of segment income shows the elimination of inter-segment transactions. (Note 3) As for KDDI Summit Global Singapore Pte. Ltd., due to the environment encompassing local accounting in the areas where subsidiaries KDDI Summit Global Myanmar Co., Ltd. are located, preliminary results were not obtained by the Company’s closing date for subsidiary reporting, and reporting periods were not unified. However, due to improvement for financial reporting in the first quarter of the fiscal year ending March 31, 2019, the reporting periods are unified.
31