
SLIDE 1
Temperature Coefficient of Temperature Coefficient of Radiant - - PowerPoint PPT Presentation
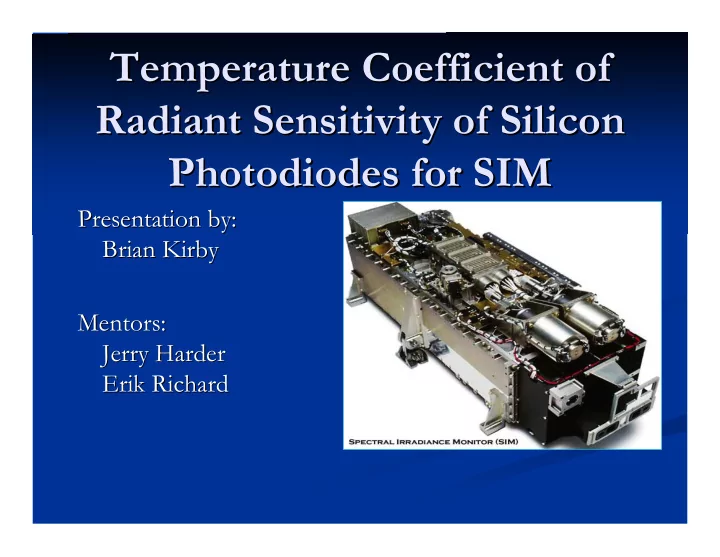
Temperature Coefficient of Temperature Coefficient of Radiant Sensitivity of Silicon Radiant Sensitivity of Silicon Photodiodes for SIM Photodiodes for SIM Presentation by: Presentation by: Brian Kirby Brian Kirby Mentors: Mentors: Jerry
Background on the SIM instrument
Radiant sensitivity and why it
Experiment
The setup
How data was taken
Results
The next steps
Summary
Celebrate the end of presentations
SIM monitors the solar
Scans the solar spectrum
This data is crucial in
The Sun
Climate change on Earth
Measures solar irradiance
About 96% of total solar
Uses electrical
Incorporates four
A prism and reference
The prism disperses the
The mirror directs light
What does SIM stand for?
Spectral Irradiance Monitor
Ratio of output current to light power received
Amps/watt
Function of wavelength and temperature
Measured at all wavelengths at a controlled
Scaled to the temperature of diodes at time of reading
1 1 1
The radiant sensitivity curves are plotted against wavelengths
These curves will scale if the temperature changes
If not taken into account, the solar irradiance data will be wrong
SORCE SIM Temps
17 18 19 20 21 22 23 24 25 26 90 180 270 360 Time (min) Temp (C)
ESR CCD Pixel 12000 Diode, Vis1 Diode, Vis2 Diode, IR Diode, U V CCD Pixel 1 Case, front aperture Case, near focalplane Case, near center Case, near prism drive prism
If not taken into
Courtesy of NASA http://spaceflight.nasa.gov/station/flash/start.swf
What is Radiant Sensitivity?
Amps of output current/watt of power received
Simulate Sun With Lasers Split the Beam 50% 50% Control Photodiode Test Photodiode Constant intensity and wavelength Kept at room temperature. Temperature is monitored along with output voltage. Temperature is changed. Temperature is monitored along with
Laser is kept at constant
Thermoelectric cooler
Monitors laser output and
Thermoelectric Coolers
Operational amplifier
Thermistors
To assure we
What is the purpose of enclosing the experiment
Tested the two
Also tested how the gain
LabView
The data can be
The readings are also
LabView Virtual Interface LabView Block Diagram
Data was taken at 670nm, 830nm and 904nm
Each wavelength was tested at a range of
Each temperature test lasted one hour
Before and after each test a baseline test was
The data was imported into IDL
Statistics were done on all experiments to verify good
Baseline reading were taken into account
The ratio of test diode output to the control diode
A line was fit to the data using a
This line is the temperature coefficient of radiant sensitivity
Phased experiment needs to be created
More wavelengths need to be measured
The lasers need to be tested accurately
The next SIM should be calibrated with a
This calibration will
Without this correction it will be impossible for
SIM is designed to measures the solar spectrum
This data is crucial to understanding the Sun and
This experiment was designed to help make the
Any Questions?