Activity Coefficient ( ) Davies Equation ln + = - A Z 2 [I 0.5 / (1 - - PowerPoint PPT Presentation

activity coefficient
SMART_READER_LITE
LIVE PREVIEW

Activity Coefficient ( ) Davies Equation ln + = - A Z 2 [I 0.5 / (1 - - PowerPoint PPT Presentation

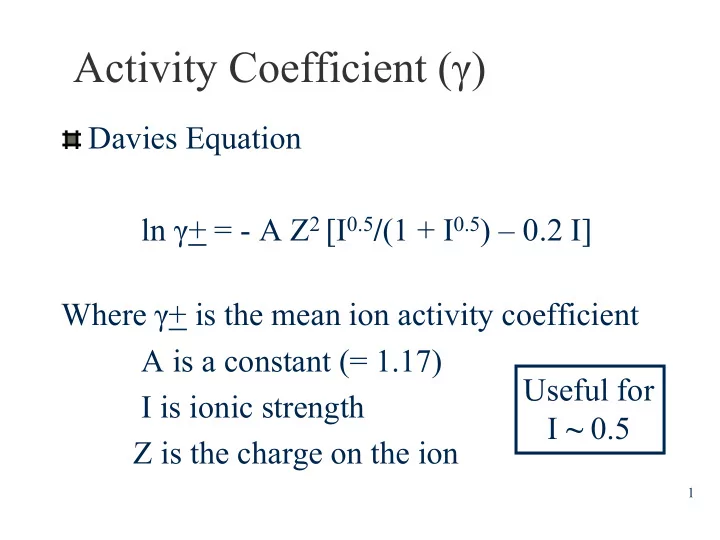
Activity Coefficient ( ) Davies Equation ln + = - A Z 2 [I 0.5 / (1 + I 0.5 ) 0.2 I] Where + is the mean ion activity coefficient A is a constant (= 1.17) Useful for I is ionic strength I ~ 0.5 Z is the charge on the ion 1


slide-1
SLIDE 1

1

Activity Coefficient (γ)

Davies Equation ln γ+ = - A Z2 [I0.5/(1 + I0.5) – 0.2 I] Where γ+ is the mean ion activity coefficient A is a constant (= 1.17) I is ionic strength Z is the charge on the ion Useful for I ~ 0.5

slide-2
SLIDE 2

2

Comparison of Davies Equation & Extended Debye-Huckel for monovalent Ions

Morel & Hering 1993

slide-3
SLIDE 3

3

Activity Coefficient

  • vs. Conc.,

Monovalent & Divalent Systems

slide-4
SLIDE 4

4

Activity Coefficient

  • vs. Conc.,

Ideal, Monovalent & Divalent Systems

(Kennedy 1990)

γ

slide-5
SLIDE 5

5

Activity

  • vs. Conc., Ideal,

Monovalent & Divalent Systems (Kennedy 1990)

slide-6
SLIDE 6

6

Putting It All Together

Calculate ionic strength from concentrations of all ions in solution using I = 0.5 Σ Z2 m Use Davies Equation to calculate activity coefficients for all ions of interest (Z = 1,2,3,4) ln γ+ = - A Z2 [I0.5/(1 + I0.5) – 0.2 I] Calculate activity of the ions of interest using their concentrations and activity coefficients a = [i] γ

slide-7
SLIDE 7

7

Example: pH of SW

pH is defined as the negative logarithm of the hydrogen ion activity pH = -log aH+ At a typical ionic strength of seawater I = 0.7 From Davies Equation H+ activity coefficient ln γ = - A Z2 [I0.5/(1 + I0.5) – 0.2 I] If Z = 1 & A = 1.17 then ln γ = -0.37 & γ = 0.69

slide-8
SLIDE 8

8

Example: pH (cont.)

If a typical seawater pH is 8.2 Then H+ activity is 1 x 10-8.2 or 6.31 x 10⁻⁹ M From a = [i]γ or aH+ = [H+]γH+ & calculated γ = 0.69 6.31 x 10⁻⁹ M = [H+] x 0.69 [H+] = 9.14 x 10⁻⁹ M Activity of H+ is 31% lower than it’s concentration Effectiveness of H+ is 31% lower due to crowding This phenomenon is greater for divalent ions

slide-9
SLIDE 9

9

Non-specific Interaction

Electrostatic in nature Limits effectiveness of ion in solution Use concept of activity to quantify effect

(effective concentration)

ai = [i]F γF(i) where ai = activity of ion i [i]F = free ion conc. (m) γF(i) = activity coefficient

  • f ion i

a = [i] γ In short

slide-10
SLIDE 10

10

Activity of Individual Ion Influenced by Other Ions

Ionic Strength of solution I = 0.5 Σ Z2 m where I = ionic strength Z = charge on ion m = molal conc. (molarity or molinity can also be used) a = [i] γ

slide-11
SLIDE 11

11

SW Density = 1.024763 kg/L at 20 oC (Pilson 1998)

slide-12
SLIDE 12

12

Major Components of SW

Na+, K+, Mg2+, Ca2+, Cl- and SO4

2- are most

abundant Account for 98.5 % of dissolved species in SW Have major influence on SW density Have long residence time in the ocean Generally exhibit conservative behavior

 Concentration influenced by physical processes

such as evaporation & precipitation, not chemical or biological processes

Discussing completely dissolved species

slide-13
SLIDE 13

13

Element Concentrations in Average River & Average Ocean Water with Residence Times

Broecker and Peng (1982)

slide-14
SLIDE 14

14

Cycling of SW Components

“The sea is a way station for the products of continental erosion. All substances received by the sea are ultimately passed along to the sediment…tectonic forces…eventually push the material buried in this way back above sea level where it becomes subject to erosion. Then another trip through the sea begins.” Broecker and Peng (1982)

slide-15
SLIDE 15

15

Cycling of SW Components

Most components are recycled many times within SW by a variety of processes Can determine residence times (τ) in ocean Constituents can be classified as:

 Biolimiting – totally depleted in surface water  Biointermediate – partially depleted  Biounlimited – no measurable depletion  Noncycling – reactive & removed

Broecker and Peng (1982)

slide-16
SLIDE 16

16

SW Composition

The composition of SW generally reflects two factors: 1) The relative abundance of the substance in river water (i.e., the input) 2) The presence of removal mechanisms that result in entrapment of the material in sediments (i.e., the output)

slide-17
SLIDE 17

17

Major Components of SW

Na+, K+, Mg2+, Ca2+, Cl- and SO4

2- are most

abundant Account for 98.5 % of dissolved species in SW Have major influence on SW density Have long residence time in the ocean Generally exhibit conservative behavior

 Concentration influenced only by physical

processes such as evaporation & precipitation, not chemical or biological processes

Discussing completely dissolved species

slide-18
SLIDE 18

18

Conservative Mixing

Volume Ratio of Water Mass

slide-19
SLIDE 19

19

slide-20
SLIDE 20

20

Marcet Principle (1819)

Relative composition of sea salt is nearly the same worldwide, i.e., major constituents are conservative Constancy of Composition Principle of Constant Composition (Pilson) Rule of Constant Proportions (Libes) First Law of Chemical Oceanography (Kester) Several exceptions to the rule

slide-21
SLIDE 21

21

Exceptions to the Rule

(or non-conservative behavior)

Caused by processes such as: Reduction, Dissolution, Evaporation, etc. Estuaries & Marginal Seas – largely input

  • f river water of different composition &
  • ther processes also (e.g., Baltic Sea)

Evaporation in Isolated Basins – evaporites Hydrothermal Vents – brines high in salt Precipitation & Dissolution – aragonite & calcite dissolution in deep ocean increase Ca2+ levels with precipitation elsewhere

slide-22
SLIDE 22

22

Exceptions to the Rule

(continued)

Anoxic Basins – bacterial reduction of SO4

2- to S2-

Exchange at the Air-Sea interface – causes fractionation of many components Freezing – sea ice can be deficient in one or more constituents causing local concentration anomalies Interstitial Waters or Pore Waters – variety

  • f processes many related to high surface

areas in contact with water & anoxia

slide-23
SLIDE 23

23

Cl- has been Described as the Ultimate Conservative Tracer

Highest concentration in SW Not biologically depleted Not chemically limited One of the longest Residence Times (1 x 10⁸ yr) Generally pretty boring Oceanographers have used Cl- concentration to define the concentration of ocean water masses Concept of Chlorinity = Cl- (+ Br-) content of SW

slide-24
SLIDE 24

24

Chlorinity (Cl)

Amount of Cl-, Br- and I- in grams, contained in 1 kg of seawater assuming Br- and I- replaced by Cl- The number giving chlorinity in per mille of a seawater sample is by definition identical with the number giving the mass with unit gram of atomic weight silver just necessary to precipitate the halogens in 0.3285234 kg of the seawater sample (Jacobsen & Knudsen, 1940).

slide-25
SLIDE 25

25

Salinity (S)

Historical Definition - Total amount of solid material, in grams, contained in 1 kg of seawater when all carbonate has been converted to oxide, the bromide and iodine replaced by chlorine, and all organic matter completely oxidized Practical Salinity Scale – Conductivity of seawater compared to KCl at 32.4356 g/kg (15

  • C)
slide-26
SLIDE 26

26

Practical Salinity Scale (PSS 1978)

RT = C (sample)/C (std seawater) C = conductivity at specified temp. & pressure Formerly used units of parts per thousand (o/oo) Unitless since based on a ratio Often see PSU or practical salinity units Calibrate instrumentation with SW standard

slide-27
SLIDE 27

27

Absolute Salinity (SR)

SCOR/IAPSO

Scientific Committee on Oceanic Research International Agency for the Physical Sciences of the Oceans

 WG 127 Thermodynamics & Equations of State of SW

 Density, Enthalpy, Entropy, Potential

temp.,Freezing temp.,

 Dissolved oxygen, Alkalinity, TCO2 , Ca, Silica

SR = (35.16504 / 35) g/kg x S

slide-28
SLIDE 28

28

Precision in Salinity by Various Methods

1) Composition Studies of major components ± 0.01 2) Evaporation to dryness ± 0.01 3) Chlorinity ± 0.002 4) Sound Speeds ± 0.03 5) Density ± 0.004 6) Conductivity ± 0.001 7) Refractive index ± 0.05 8) Inductive Salinometer

slide-29
SLIDE 29

29

Relationship between Salinity & Chlorinity

S = 1.80655 Cl See Website for Salinity Handouts 1 - 4

slide-30
SLIDE 30

30

CTDs

www.seabird.com www.valeport.co.uk

slide-31
SLIDE 31

31

slide-32
SLIDE 32

32

Chemical Equilibria

General representation

a A + b B c C + d D

Where uppercase letters are chemical species and lowercase letters are coefficients (i.e. # of atoms or moles)

slide-33
SLIDE 33

33

Equilibrium Constant [C]c [D]d K = --------------- [A]a [B]b where [ ] = concentration, usually molar

slide-34
SLIDE 34

34

Solubility Equilibria

Ba2+

(aq) + SO4 2- (aq)

BaSO4(s)

  • r by convention

BaSO4(s) Ba2+

(aq) + SO4 2- (aq)

slide-35
SLIDE 35

35

Solubility Product (equilibrium constant)

[Ba2+] [SO42-] K

sp = ------------------ = [Ba2+] [SO42-]

1 aBa a

SO4

K

sp = ------------------ = aBa a SO4

1 activity of solid is defined as = 1

slide-36
SLIDE 36

36

Solubility Calculated

Solubility (S) is the concentration of individual ions generated from an insoluble compound BaSO4(s) Ba2+

(aq) + SO4 2- (aq)

S = [Ba2+] = [SO4

2-]

slide-37
SLIDE 37

37

Solubility Calculation (continued)

Given

KSP = [Ba2+][SO4

2-] = 2.0 x 10⁻¹⁰

Then S = √ KSP = √ 2.0 x 10-10 = 1.4 x 10⁻⁵ So

S = [Ba2+] = [SO4

2-] = 1.4 x 10⁻⁵

slide-38
SLIDE 38

38

Activity Correction

a Ba aSO4

KSP = --------------- = aBa aSO4 1

Since

aBa = γBa [Ba2+] & aSO4 = γSO4[SO4

2-]

Substituting

KSP = aBaaSO4 = γBa [Ba2+]γSO4[SO4

2-]

slide-39
SLIDE 39

39

Solubility Calculation (completed)

Since

KSP = [Ba2+][SO4

2-] & γBa = γSO4

Then

KSP

S = -------

√ γ2

To determine the solubility of BaSO4 in a solution containing other ions (like SW), you must calculate the activity coefficient (γ)