
SLIDE 1
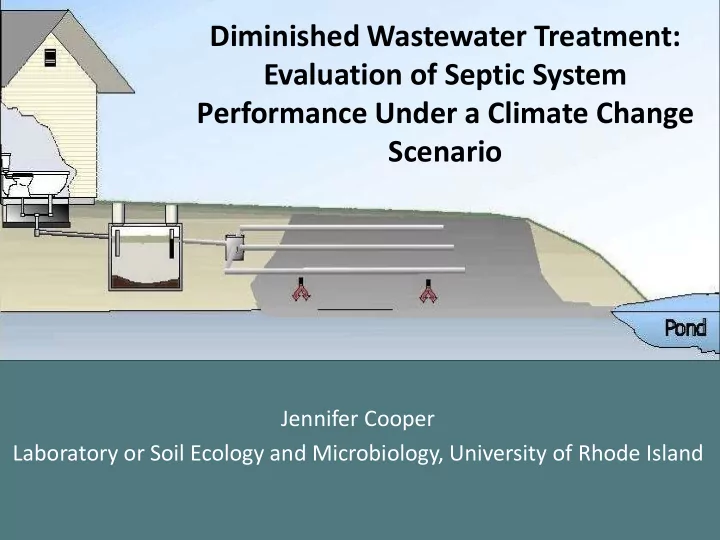
Diminished Wastewater Treatment: Evaluation of Septic System Performance Under a Climate Change Scenario
Jennifer Cooper Laboratory or Soil Ecology and Microbiology, University of Rhode Island
Diminished Wastewater Treatment: Evaluation of Septic System - - PowerPoint PPT Presentation
Diminished Wastewater Treatment: Evaluation of Septic System Performance Under a Climate Change Scenario Jennifer Cooper Laboratory or Soil Ecology and Microbiology, University of Rhode Island Acknowledgements and Funding Funding: RI
Jennifer Cooper Laboratory or Soil Ecology and Microbiology, University of Rhode Island
Funding:
Awards
Research Team:
Undergraduate Helpers:
Wastewater Treatment Plants Septic Systems
O2 O2 O2 O2 O2
hydroxides
precipitation
degradation
filtration
Source : Consortium for Climate Risk in the Urban Northeast
Intergovernmental Panel on Climate Change (2013 report): 100 year predictions (Northeast) –
precipitation
temperature 2-5°C
<1’
OWTS function under elevated sea level / groundwater conditions
Source: NEOWTC @ URI
1 2 3 4 5 6 7 8 9 10 11 12 13 14 5 10 15 20 25 30 [O2] (mg/L) T (oC)
Davidson et al. (1998)
WATER TABLE
Conventional System
Advanced System
20°C 25°C
Water Table
46 cm
Water Table Water Table
77 cm 77 cm
P&S
18.5 19.0 19.5 20.0 20.5
P&S - present climate P&S - climate change Present climate Climate change
Depth (cm)
O2 (%)
SND
18.5 19.0 19.5 20.0 20.5 Depth (cm)
O2 (%)
GEO
O2 (%)
18.5 19.0 19.5 20.0 20.5
Hotter, wetter soil – less oxygen, more reducing conditions
P&S 1 2
0.0 0.5 1.0 1.5 2.0 2.5 3.0 Present Climate Climate Change BOD5 (mg/L)
SND 1 2
BOD5 (mg/L) 0.0 0.5 1.0 1.5 2.0 2.5 3.0 Present Climate Climate Change
GEO 1 2
0.0 0.5 1.0 1.5 2.0 2.5 3.0 Present Climate Climate Change BOD5 (mg/L)
Increased temperature likely speeds microbial C degradation
P&S
1 2
2 4 6 Present Climate Climate Change FC (CFU/100mL)
SND
1 2
FC (CFU/100mL) 2 4 6 Present Climate Climate Change
GEO
1 2
2 4 6 Present Climate Climate Change FC (CFU/100mL)
Increased moisture likely diminished microbial attachment
P&S
1 2
20 40 60 Present Climate Climate Change TN removal (%)
Conv.: Increased moisture, more anoxia, more hetero. denit. Adv.: Temperature increased C degradation, limited hetero. denit.
GEO
1 2
20 40 60 Present Climate Climate Change TN removal (%)
SND
1 2
TN removal (%)
20 40 60 Present Climate Climate Change
P&S
1 2
20 40 60 80 100 Present Climate Climate Change TP removal (%)
SND 1 2
TP removal (%) 20 40 60 80 100 Present Climate Climate Change
GEO 1 2
20 40 60 80 100 Present Climate Climate Change TP removal (%)
Increased moisture likely caused reduction/dissolution of metals allowed P mobilization
P&S
P&S PC P&S CC
Proportion of P in output water
0.0 0.2 0.4 0.6 0.8 1.0 1.2
Non-metal Al Fe Mn
SND
SND PC SND CC 0.0 0.2 0.4 0.6 0.8 1.0 1.2
GEO
GEO PC GEO CC
0.0 0.2 0.4 0.6 0.8 1.0 1.2
Non-metal Non-metal Fe Fe Fe Fe Fe Al Al Al Al Al Mn Mn
Climate change: P in output water due to metals becomes more important than non-metal mechanisms (e.g. P-accumulating organism)
Units: kg/yr (FC in CFU/yr)
kg/yr (FC in CFU/yr) in output water
BOD5: 0.180 FC: 0.0 TN: 6.32 TP: 0.241 BOD5: 0.05 FC: 1.6 x 10⁸ TN: 6.50 TP: 0.489 Present Climate Climate Change
kg/yr (FC in CFU/yr) in output water
BOD5: 0.180 FC: 0.0 TN: 6.32 TP: 0.241 BOD5: 0.05 FC: 1.6 x 10⁸ TN: 6.50 TP: 0.489 Present Climate Climate Change
kg/yr (FC in CFU/yr) in output water
BOD5: 0.180 FC: 0.0 TN: 6.32 TP: 0.241 BOD5: 0.05 FC: 1.6 x 10⁸ TN: 6.50 TP: 0.489 Present Climate Climate Change
kg/yr (FC in CFU/yr) in output water
BOD5: 0.180 FC: 0.0 TN: 6.32 TP: 0.241 BOD5: 0.05 FC: 1.6 x 10⁸ TN: 6.50 TP: 0.489 Present Climate Climate Change
BOD5: 0.0-0.03 FC: 1.9-2.2 x 10⁸ TN: 6.73-7.04 TP: 0.241-0.259 BOD5: 0.10-0.13 FC: 0.0 TN: 6.13-6.26 TP: 0.0-0.011
Present Climate Climate Change
kg/yr (FC in CFU/yr) in output water
BOD5: 0.0-0.03 FC: 1.9-2.2 x 10⁸ TN: 6.73-7.04 TP: 0.241-0.259 BOD5: 0.10-0.13 FC: 0.0 TN: 6.13-6.26 TP: 0.0-0.011
Present Climate Climate Change
kg/yr (FC in CFU/yr) in output water
BOD5: 0.0-0.03 FC: 1.9-2.2 x 10⁸ TN: 6.73-7.04 TP: 0.241-0.259 BOD5: 0.10-0.13 FC: 0.0 TN: 6.13-6.26 TP: 0.0-0.011
Present Climate Climate Change
kg/yr (FC in CFU/yr) in output water
BOD5: 0.0-0.03 FC: 1.9-2.2 x 10⁸ TN: 6.73-7.04 TP: 0.241-0.259 BOD5: 0.10-0.13 FC: 0.0 TN: 6.13-6.26 TP: 0.0-0.011
Present Climate Climate Change
kg/yr (FC in CFU/yr) in output water
39% of US population reside in coastal shoreline counties
Positive Effect
Negative
bacteria