
SLIDE 1
1 1
Variability in TCP Round-trip Times Variability in TCP Round-trip Times
Jay Jay Aikat Aikat Jasleen Kaur Jasleen Kaur Don Smith Don Smith Kevin Kevin Jeffay Jeffay
Department of Computer Science Department of Computer Science University of North Carolina at Chapel Hill University of North Carolina at Chapel Hill The The UNIVERSITY UNIVERSITY of
- f NORTH CAROLINA
NORTH CAROLINA at at CHAPEL HILL CHAPEL HILL
http://www. http://www.cs cs. .unc unc. .edu edu/~ /~jasleen jasleen/research/RTT /research/RTT
2 2
TCP Round-trip Times ( TCP Round-trip Times (RTTs RTTs) )
Popular belief: Popular belief: RTTs RTTs do not vary significantly within TCP connections do not vary significantly within TCP connections
− − Mean RTT can be used to approximate per-segment
Mean RTT can be used to approximate per-segment RTTs RTTs
- TCP throughput models
TCP throughput models
[Altman00, Kumar98, Lakshman97, Mathis97, Padhye98, [Altman00, Kumar98, Lakshman97, Mathis97, Padhye98, … …] ]
- Analysis based on TCP behavior
Analysis based on TCP behavior
[Zhang02] [Zhang02]
− − RTT of initial segments is
RTT of initial segments is “ “typical typical” ” for a TCP connection for a TCP connection
[Jiang02] [Jiang02]
Do per-segment RTTs vary significantly within a TCP connection? Do per-segment Do per-segment RTTs RTTs vary significantly within a TCP connection? vary significantly within a TCP connection?
3 3
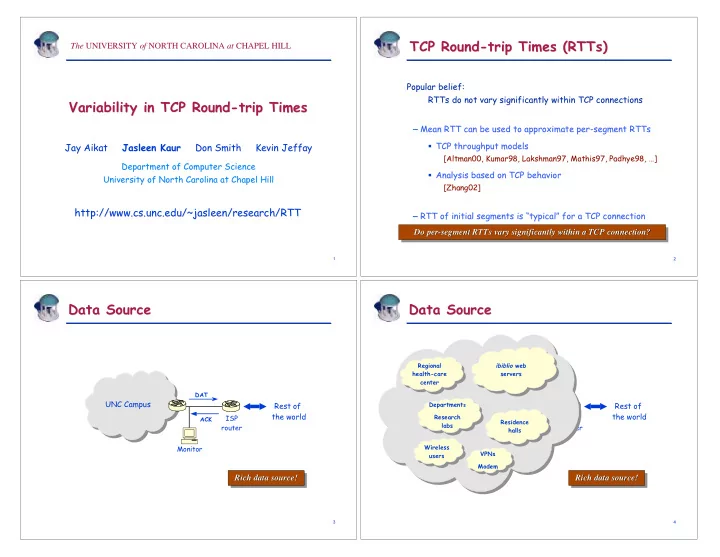
Data Source Data Source
UNC Campus UNC Campus Rest of the world
Monitor ISP router
Rich data source! Rich data source! Rich data source!
DAT ACK
4 4
Data Source Data Source
UNC Campus UNC Campus Rest of the world
Monitor ISP router
Rich data source! Rich data source! Rich data source!
DAT ACK
UNC UNC
Regional health-care center Regional health-care center Departments Research labs Departments Research labs Residence halls Residence halls Wireless users Wireless users VPNs Modem VPNs Modem ibiblio web servers ibiblio web servers