Update on the Use of Bone Turnover Markers Outline Potential - - PowerPoint PPT Presentation

update on the use of bone turnover markers outline
SMART_READER_LITE
LIVE PREVIEW

Update on the Use of Bone Turnover Markers Outline Potential - - PowerPoint PPT Presentation

Update on the Use of Bone Turnover Markers Outline Potential clinical uses and limitations of current BTMs Douglas C. Bauer, MD Other considerations in clinical practice Professor of Medicine, Epidemiology & Biostatistics Six


slide-1
SLIDE 1

Page 1 Update on the Use of Bone Turnover Markers

Douglas C. Bauer, MD Professor of Medicine, Epidemiology & Biostatistics University of California, San Francisco

No Disclosures

Outline

  • Potential clinical uses and limitations of

current BTMs –Other considerations in clinical practice

  • Six criteria for BTM monitoring

–Clinical cutpoints –Reproducibility

  • A path forward…

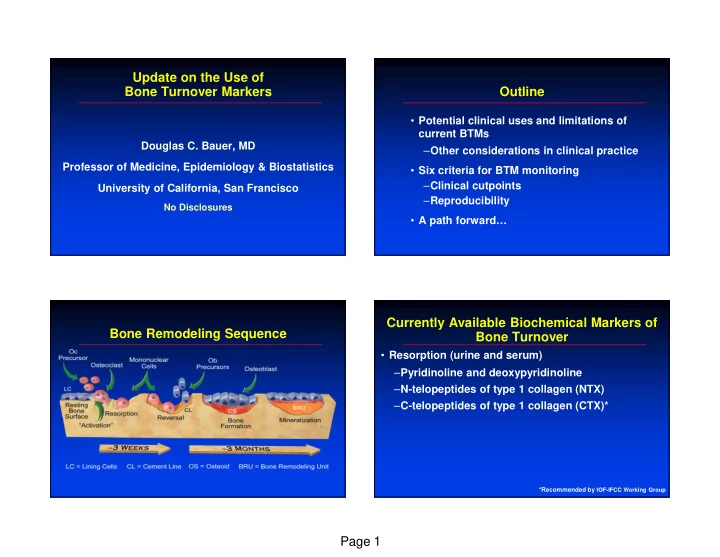
Bone Remodeling Sequence Currently Available Biochemical Markers of Bone Turnover

  • Resorption (urine and serum)

–Pyridinoline and deoxypyridinoline –N-telopeptides of type 1 collagen (NTX) –C-telopeptides of type 1 collagen (CTX)*

*Recommended by IOF-IFCC Working Group

slide-2
SLIDE 2

Page 2

Free PYD and DPD (40%)

(OH) NH2 COOH OH COOH NH2 NH2 COOH C C N N α1 α1 α2 Hyl Hyl Bone matrix NTX COOH NH2 COOH CTX NH2

C-telopeptides N-telopeptides Crosslinked C and N-telopeptides (60%)

PYD = pyridinoline; CTX = C-telopeptides of type I collagen DPD = deoxypyridinoline; NTX = N-telopeptides of type I collagen

Markers of Bone Resorption: Type I Collagen Crosslinks

Osteoclastic bone resorption

Currently Available Biochemical Markers of Bone Turnover

  • Formation (serum)

–Osteocalcin (OC) –Bone alkaline phosphatase (Bone ALP) –N-terminal propeptide of type I procollagen (PINP)*

*Recommended by IOF-IFCC Working Group

C-Terminal pro-peptid (PICP)

+

N-Terminal pro-peptid (PINP) Procollagen type I Collagen type I Intact PINP (trimer - liver) PINP (monomer – kidneys)

Markers of Bone Formation: PINP Clinical Utility of BTMs in the Near Future

  • Unlikely use

–Diagnose osteoporosis –Improve compliance with treatments

  • Possible use

–Predict treatment benefit before initiation of therapy –Predict fracture risk after discontinuation of therapy –Predict fracture risk in untreated individuals

IOF-IFCC Bone Marker Standards Working Group, Osteoporosis Int, 2011

slide-3
SLIDE 3

Page 3 Fracture Prediction In Untreated Individuals

  • Elevated urine resorption markers associated

with fracture in most studies

  • Less consistent data for serum or formation

markers –Meta analysis of PINP or sCTX: RR=1.2 per SD increase (weaker than BMD)

  • Value of combining markers + BMD unclear
  • Markers are an alternative when BMD

unavailable

Clinical Utility of BTMs in the Near Future

  • Unlikely use

–Diagnose osteoporosis –Improve compliance

  • Possible use

–Predict fracture risk in untreated individuals –Predict treatment benefit before initiation of therapy –Predict fracture risk after discontinuation of therapy

  • Likely use

–Predict treatment efficacy among treated individuals

IOF-IFCC Bone Marker Standards Working Group, Osteoporosis Int, 2011

FLEX Placebo Group

  • Received 5 yrs of ALN then 5 yrs of
  • PBO. Blinded
  • BMD and BTMs (BAP and NTX) when

PBO begun and after 1-3 yrs.

  • Do short-term changes in BTMs after

discontinuation predict long-term fracture outcomes?

Bauer et al, Jama Internal Med 2014

FLEX PBO: Proportion With Fracture by 1 Year Change in BTMs

slide-4
SLIDE 4

Page 4 Clinical Utility of BTMs in the Near Future

  • Unlikely use

–Diagnose osteoporosis –Improve compliance

  • Possible use

–Predict fracture risk in untreated individuals –Predict treatment benefit before initiation of therapy –Predict fracture risk after discontinuation of therapy

  • Likely use

–Predict treatment efficacy among treated individuals

IOF-IFCC Bone Marker Standards Working Group, Osteoporosis Int, 2011

Using BTMs to Predict Treatment Efficacy Among Treated Individuals

  • Assess BTM changes with

therapy; “ “ “ “monitoring” ” ” ”

  • Goal is to identify those

with suboptimal response and intervene

  • Are there guiding

principles?

Six Suggested Criteria for Routine BTM Monitoring of Treated Patients

1. Large treatment-related changes in BTMs

– True for most available therapies

2. Significant between-person heterogeneity in BTM response to a therapy

– True for alendronate, likely true for others

3. Short-term changes in BTM measurements associated with long-term fracture risk

– True for several bisphosphontes, raloxifene

Schousboe et al, Curr Osteoporos Rep, 2012 Bell et al, JBMR, 2012

Reduction in uCTX and New Vertebral Fracture: Risedronate

Risedronate 5 mg

3 and 6 month change in a CTX (%) Incidence %

25 15 10 5

  • 70
  • 65
  • 60
  • 55
  • 55
  • 50
  • 45
  • 40
  • 35
  • 30
  • 25
  • 20
  • 15
  • 10
  • 5

5

0-3 year vertebral fracture incidence

n=358 risedronate-treated postmenopausal women Eastell R et al. J Bone Miner Res, 2003

slide-5
SLIDE 5

Page 5

n=3105 alendronate-treated postmenopausal women

Bauer et al. J Bone Miner Res,2004

Probability of non-spine fracture

  • 100
  • 50

50 100 0.05 0.10 0.15 0.20 0–4 year non-spine fracture incidence

1-year change in bone ALP (%)

Reduction in Bone ALP and Non-spine Fracture: Alendronate

Alendronate 5-10 mg

Six Suggested Criteria for Routine BTM Monitoring of Treated Patients

  • 4. Optimal BTM cutpoint that identifies patients at

sufficiently high risk to change therapy

  • Clinicians need validated cutpoints
  • May differ for each BTM, treatment class
  • Ideal cutpoint: >LSC, identifies small group at high risk

Schousboe et al, Curr Osteoporos Rep, 2012

Placebo Group ALN Group

↓BAP>30%

ALN Group

↓BAP<30%†

Vertebral 7.3% 3.8%* 4.3%* Non-spine 9.8% 6.8%* 8.7% Hip 1.0% 0.2%* 0.8%

Fracture Rates (Mean F/U 3.6 Years)

FIT: Fracture Rate With and Without “ “ “ “Good” ” ” ” Marker Response

†44% of ALN-treated women *p<0.001 compared to PBO group

Bauer et al. J Bone Miner Res. 2004

Placebo Group RIS Group

↓sCTX>30%

RIS Group

↓sCTX<30%†

Vertebral NA NA NA Non-spine NA 1.7%* 4.3% Hip NA NA NA

Fracture Rates (Mean F/U 1 Year)

IMPACT: Fracture Rate With and Without “ “ “ “Good” ” ” ” Marker Response

†17% of RIS-treated women *p=0.002 compared to <30% group

Eastell et al. J Bone Miner Res. 2011

slide-6
SLIDE 6

Page 6 Six Suggested Criteria for Routine BTM Monitoring of Treated Patients

  • 4. BTM cutpoint that identifies patients at

sufficiently high risk to change therapy

  • 5. Adequate test reproducibility

Schousboe et al, Curr Osteoporos Rep, 2012

Importance of Test Reproducibility

  • Test reproducibility

–Important when assessing a single measurement of bone turnover –Extremely important if assessing change in BTM

  • Pre-analytic variability (from diurnal variation,

fasting status, exercise, etc.) –Poorly addressed in early BTM studies

IOF-IFCC Bone Marker Standards Working Group, Osteoporosis Int, 2011

Importance of Laboratory Reproducibility

  • Analytic reproducibility

–Assay and laboratory variability

  • Standardization of assays and performance

–Automated platforms

  • Document commercial laboratory proficiency

–In US, assessed by College of American Pathologists and others –Data not easily available to clinicians…

Published Studies of BTM Lab Reproducibility: Europe

  • Low and high serum and urine pools
  • Identical aliquot from each pool sent to 73 laboratories

in 5 countries – Labs agreed to participate, unblinded

  • Between laboratory coefficient of variation (CV)

– BALP (IRMA) 16-25% – Osteocalcin (EIA) 24-31% – Total PYD and DPD/Cr (HPLC) 27-28% – NTX/Cr (EIA) 39%

Siebel et al, Clin Chem 2001

slide-7
SLIDE 7

Page 7 Published Studies of BTM Lab Reproducibility: United States

  • Pooled serum and urine from postmenopausal women
  • Identical aliquots sent to 6 high volume commercial labs

– 5 times over 8 mo. period, then 5 aliquots together the last time – Labs unaware, submitted as clinical specimens

  • Serum BALP assays:

– Ostase ECi (N=5) and Metra (N=1)

  • Urine NTX/Cr assays:

– Vitros ECi (N=4) and Osteomark ELISA (N=2)

Schafer et al, Osteoporos Int, 2010

Serum BALP Results Over 8 Months From 6 Commercial Labs Serum BALP: US Laboratory Longitudinal Reproducibility

Lab Assay Mean (SD) CV% (CI) ARUP Ostase 13.8 (1.3) 9 (6-27) Esoterix Ostase 14.2 (0.4) 3 (2-9) LabCorp Ostase 11.4 (2.7) 24 (14-77) Mayo Ostase 14.4 (0.9) 6 (4-18) Quest Ostase 14.4 (1.5) 10 (6-31) Specialty Metra 24.0 (1.4) 6 (3-16)

Serum BALP: US Laboratory Within Run Reproducibility

Lab Assay Mean (SD) CV% (CI) ARUP Ostase 15.6 (0.6) 4 (2-11) Esoterix Ostase 14.0 (0.0) LabCorp Ostase 11.3 (1.8) 16 (9-47) Mayo Ostase 13.2 (1.1) 8 (5-24) Quest Ostase 14.2 (0.3) 2 (1-6) Specialty Metra 25.8 (0.9) 4 (2-10)

slide-8
SLIDE 8

Page 8 Urine NTX/Cr Results Over 8 Months From 6 Commercial Labs Urine NTX/Cr: US Laboratory Longitudinal Reproducibility

Lab Assay Mean (SD) CV% (95% CI) ARUP Vitros 35.8 (1.9) 5 (3, 16) Esoterix Vitros 35.8 (2.9) 8 (5, 30) LabCorp Osteomark 74.2 (19.3) 26 (15, 88) Mayo Vitros 35.0 (3.0) 9 (5, 25) Quest Vitros 34.0 (2.2) 7 (4, 19) Specialty Osteomark 42.8 (16.0) 38 (22, 168)

Urine NTX/Cr: US Laboratory Within Run Reproducibility

Lab Assay Mean (SD) CV% (95% CI) ARUP Vitros 36.4 (0.5) 2 (1-4) Esoterix Vitros 34.0 (1.4) 4 (3-12) LabCorp Osteomark 59.0 (4.2) 7 (4-21) Mayo Vitros 40.0 (1.6) 4 (2-11) Quest Vitros 34.0 (1.2) 4 (2-10) Specialty Osteomark 52.8 (9.1) 17 (10-53)

Does Lab Reproducibility Matter?

  • Hypothetical estimate of the effects of observed

lab variability on reporting of paired BTM measurements

  • Example: if a clinician orders a baseline and

follow-up BTM using the same lab, what are 95% CI for a known 50% reduction? – Plausible range of reported results for a true 50% decrease in BTM

slide-9
SLIDE 9

Page 9 Plausible Results For Known 50% Decrease in BALP or NTX/Cr

  • Plausible results for -50% change in BALP

– Esoterix (Ostase): -56% to -43% – Labcorp (Ostase): -89 to +7% (i.e. could be reported as a 89% decrease or a 7% increase)

  • Plausible results for -50% change in NTX/Cr

– ARUP (Vitros): -61% to -37% – Specialty (Osteomark): -143% to +100% Note: even worse if baseline and follow-up measurements sent to different labs!

A Path Forward…

  • 4. BTM cutpoint that identifies patients at

sufficiently high risk to change therapy

  • Additional treatment and BTM-specific

data from existing and future trials

  • Consistent approach: same BTMs

(sCTX and PINP), outcomes, analysis

  • Pool individual level data across

studies to determine optimal cutpoints

FNIH Bone Quality Biomarkers Consortium Project

A Path Forward…

  • 5. Adequate test reproducibility
  • Better assays and better quality control…
  • Collaboration between manufacturers,

commercial labs, and researchers

  • Reference standards, harmonize assays
  • Publish results

IOF-IFCC Bone Marker Standards Working Group, Osteoporosis Int, 2011 National Bone Health Alliance BTM Project, Osteoporosis Int, 2012

A Path Forward…

  • 6. Ideally, evidence that use of BTMs improves

clinical outcomes

  • Usually large, expensive studies

(example: fracture rates in those randomized to BTM or no BTM monitoring)

  • More feasible study designs? Surrogates?

(example: use change in FEA as outcome)

slide-10
SLIDE 10

Page 10 Summary: How to Improve the Clinical Utility of Bone Turnover Markers

  • Continued advances and optimism!
  • Most likely clinical use: monitoring therapy

–Some believe data adequate now

  • Several criteria clearly need additional work

–Optimal BTM cutpoints –Improved laboratory reproducibility

  • Can we show that use of BTM improves clinical
  • utcomes?

Acknowledgements

  • Investigators and staff

at San Francisco CC

  • Research funding from

NIAMS and NIA