
SLIDE 1
Page 1
Bone Turnover Markers in Clinical Practice: Ready for Prime Time?
Douglas C. Bauer, MD University of California San Francisco, CA No disclosures
2
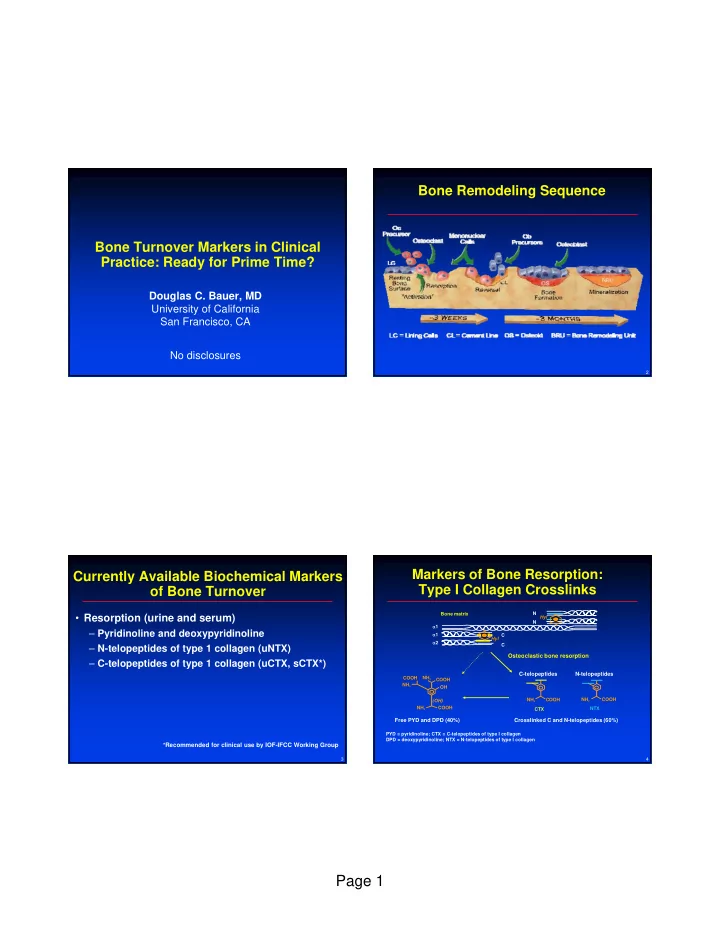
Bone Remodeling Sequence
3
Currently Available Biochemical Markers
- f Bone Turnover
- Resorption (urine and serum)
– Pyridinoline and deoxypyridinoline – N-telopeptides of type 1 collagen (uNTX) – C-telopeptides of type 1 collagen (uCTX, sCTX*)
*Recommended for clinical use by IOF-IFCC Working Group
4
Free PYD and DPD (40%)
(OH) NH2 COOH OH COOH NH2 NH2 COOH C C N N 1 1 2 Hyl Hyl Bone matrix NTX COOH NH2 COOH CTX NH2
C-telopeptides N-telopeptides Crosslinked C and N-telopeptides (60%)
PYD = pyridinoline; CTX = C-telopeptides of type I collagen DPD = deoxypyridinoline; NTX = N-telopeptides of type I collagen
Markers of Bone Resorption: Type I Collagen Crosslinks
Osteoclastic bone resorption