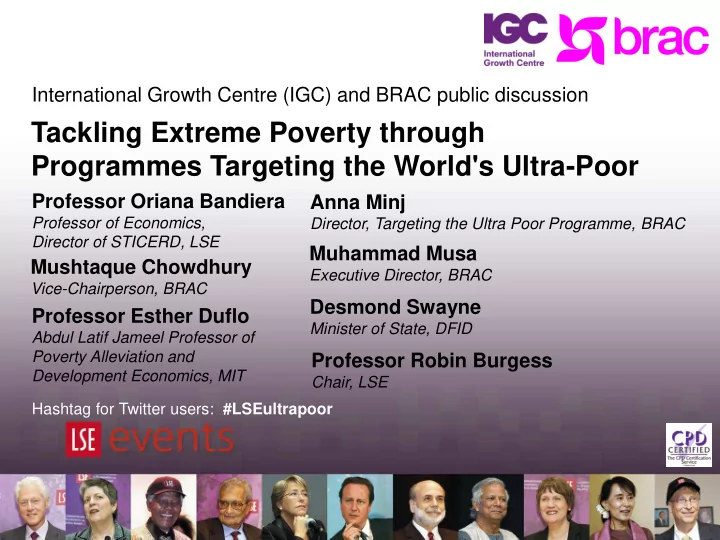
Tackling Extreme Poverty through Programmes Targeting the World's - - PowerPoint PPT Presentation

tackling extreme poverty through programmes targeting the
SMART_READER_LITE
LIVE PREVIEW

Tackling Extreme Poverty through Programmes Targeting the World's - - PowerPoint PPT Presentation

International Growth Centre (IGC) and BRAC public discussion Tackling Extreme Poverty through Programmes Targeting the World's Ultra-Poor Professor Oriana Bandiera Anna Minj Professor of Economics, Director, Targeting the Ultra Poor Programme,


slide-1
SLIDE 1

Tackling Extreme Poverty through Programmes Targeting the World's Ultra-Poor

Hashtag for Twitter users: #LSEultrapoor

International Growth Centre (IGC) and BRAC public discussion Professor Oriana Bandiera

Professor of Economics, Director of STICERD, LSE

Professor Robin Burgess

Chair, LSE

Anna Minj

Director, Targeting the Ultra Poor Programme, BRAC

Muhammad Musa

Executive Director, BRAC

Mushtaque Chowdhury

Vice-Chairperson, BRAC

Professor Esther Duflo

Abdul Latif Jameel Professor of Poverty Alleviation and Development Economics, MIT

Desmond Swayne

Minister of State, DFID

slide-2
SLIDE 2

BRAC’s Ultra-Poor Program

Results from a long-run evaluation in Bangladesh Oriana Bandiera (LSE)

slide-3
SLIDE 3

the context

  • women labor markets in Bangladeshi villages

where BRAC TUP operates

– 1309 poor villages – 23,000 HHs from different wealth classes

slide-4
SLIDE 4

women only do 3 jobs

Casual Wage Labor: Domestic Maid Livestock rearing (cows/goats) Casual Wage Labor: Agriculture Other Share of hours Branch

slide-5
SLIDE 5

hourly earnings are lower in casual jobs

Casual Wage Labor: Domestic Maid Livestock rearing (cows/goats) Casual Wage Labor: Agriculture Branch Hourly earnings, by activity

slide-6
SLIDE 6
  • nly the poor do casual jobs

Casual Wage Labor: Domestic Maid Livestock rearing (cows/goats) Casual Wage Labor: Agriculture Other Share of hours Ultra poor Middle class Upper class Near poor

slide-7
SLIDE 7

Poverty trap?

no productive assets can only do casual jobs low pay, low demand low income can’t afford assets

slide-8
SLIDE 8

BRAC’s TUP aims to break the trap

  • Eligible: poor women, identified by the communities,

verified by BRAC employees

– On avge, 6 women per community (7% of HHs) are eligible

  • Asset menu: livestock, small crafts, small retail..
  • Almost all choose a livestock combination
  • Value of transfer (9500TK= 140USD)

– 1X yearly PCE; 2X yearly earnings; 9X savings

  • Commit to retain it for 2 years, free to sell after that
  • Asset specific training - intensive over first year
slide-9
SLIDE 9

Evaluation strategy

  • Randomise the programme roll-out across 40

BRAC branch offices (1309 communities) in the poorest areas of the country

– 20 treated in 2007, 20 in 2011

  • Beneficiaries + all other poor + a sample of
  • ther wealth classes surveyed in 07,09, 11,14
  • Final sample: 6732 eligible beneficiaries &

16,297 HHs from other classes

slide-10
SLIDE 10

TUP transforms job choice..

  • 300
  • 200
  • 100

100 200 300 400 500 600 Hours devoted to livestock rearing Hours devoted to agricultural labour Hours devoted to maid work Total hours worked

Programme impacts after 4 years

20 40 60 80 100 120 140 160 Earnings (USD)

slide-11
SLIDE 11

this increases consumption & savings

20 40 60 80 100 120 Expenditure on durables Expenditure on non-durables per adult equivalent Household cash savings

Programme impacts after 4 years (USD -PPP)

slide-12
SLIDE 12

and leads to further asset accumulation

100 200 300 400 500 600 700 Value of cows Value of land Value of other business assets

Programme impacts after 4 years (USD PPP)

slide-13
SLIDE 13

benefit/cost ratio is 5.4

benefits costs

slide-14
SLIDE 14

internal rate of return is high

22% on average

positive for almost all beneficiaries larger than 5% for most larger than 22% for a large minority

slide-15
SLIDE 15

Effects are sustained after 7 years

slide-16
SLIDE 16

Expenditure on non-durables

  • 400
  • 200

200 400 600 800 1000 1200 1400 1600 2007-09 2007-11 2007-14

Yearly changes in expenditure on non-durables after 2, 4 and 7 years (USD)

Treatment Control

slide-17
SLIDE 17

Expenditure on durables

20 40 60 80 100 120 140 2007-09 2007-11 2007-14

Yearly changes in expenditure on durables after 2, 4 and 7 years (USD)

Treatment Control

slide-18
SLIDE 18

Productive assets

200 400 600 800 1000 1200 1400 1600 1800 2007-09 2007-11 2007-14

Yearly changes in productive assets after 2, 4 and 7 years (USD)

Treatment Control

slide-19
SLIDE 19

Access to land

  • 0.05

0.05 0.1 0.15 0.2 0.25 0.3 0.35 2007-09 2007-11 2007-14

Yearly changes in share with access to land after 2, 4 and 7 years

Treatment Control

slide-20
SLIDE 20

no productive assets can only do casual jobs low pay, low demand low income can’t afford assets

BRAC TUP breaks the poverty trap

combine labor with assets in small businesses higher hourly pay, regular employment higher income accumulate more assets

slide-21
SLIDE 21

Tackling Extreme Poverty through Programmes Targeting the World's Ultra-Poor

Hashtag for Twitter users: #LSEultrapoor

International Growth Centre (IGC) and BRAC public discussion Professor Oriana Bandiera

Professor of Economics, Director of STICERD, LSE

Professor Robin Burgess

Chair, LSE

Anna Minj

Director, Targeting the Ultra Poor Programme, BRAC

Muhammad Musa

Executive Director, BRAC

Mushtaque Chowdhury

Vice-Chairperson, BRAC

Professor Esther Duflo

Abdul Latif Jameel Professor of Poverty Alleviation and Development Economics, MIT

Desmond Swayne

Minister of State, DFID