t 07 henry law s constant
play

T-07 Henry Laws Constant Collect: Pressure gauge Check if the - PowerPoint PPT Presentation

T-07 Henry Laws Constant Collect: Pressure gauge Check if the plastic padding is complete and if the gauge is calibrated Prepare: A plastic soda bottle (600- 1000 mL) (2011/12/23 revised) 1 Introduction Henrys Law: under


  1. T-07 Henry Law’s Constant
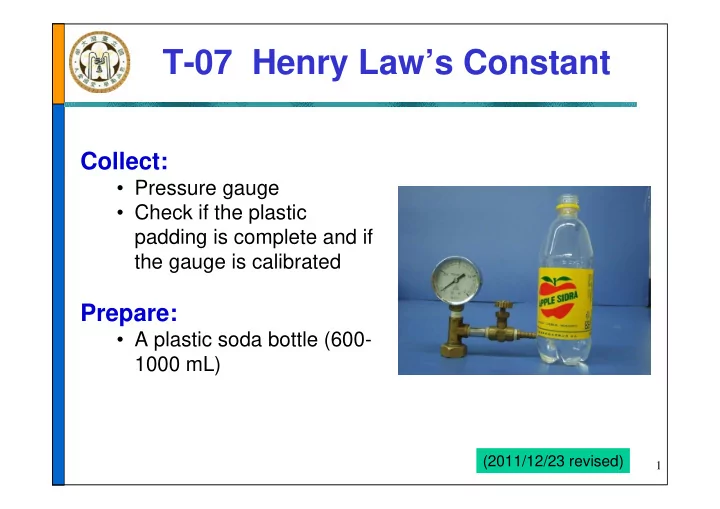
 Collect: • Pressure gauge • Check if the plastic padding is complete and if the gauge is calibrated Prepare: • A plastic soda bottle (600- 1000 mL) (2011/12/23 revised) 1

  2. Introduction Henry’s Law: under constant temperature, the concentration of gas that dissolved in solution is proportional to the partial pressure of gas P = K ‧ M P: partial pressure of solute (gas) above the solution M: concentration of solute in the solution K: Henry’s law constant P i = K ‧ M i (1) P f = K ‧ M f (2) P f – P i = K(M f – M i ) = K ‧ Δ M (2) – (1) P f = K ‧ Δ M + P i Slope = K 2

  3. Procedure 1. Measuring the Volume  Measure by weighing or by graduated cylinder  Plastic soda bottle (600~1000 mL) V g  Measure the weight of empty bottle  Fill with water and measure the weight, then convert into volume V l  Pour out 1/3 of water, then measure again  Calculate volume of water in bottle V l  Calculate volume of gas in bottle V g 3

  4. Procedure 2. Set up Pressure Gauge  Check for any gas leak  Calibrate pressure gauge (A)  Close (A) gas valve  Connect pressure gauge to soda bottle, tighten and then turn another 45 o  Squeeze bottle to check for gas leak Notice: Do not tighten the pressure gauge too tight or tilt the gauge to prevent the opening of the bottle from abrasions 4

  5. Procedure 3. Fill With Carbon Dioxide A open Close (2) (5) (1) Open Close A A (3) (4) (3) Open valve A until the pressure gauge (1) Connect the supplying rubber tube reads 1.5 ~ 1.6 kg/cm 2 (2) Open the CO 2 –supplying valve (4) Close valve A about 15 ° (5) Close CO 2 –supply valve (6) Swirl bottle to dissolve the CO 2 gas (7) Repeat CO 2 supply-dissolve steps several times till equilibrium pressure is ca. 1.5 kg/cm 2 5

  6. Outline of Procedures ( P i , M i ) ( P f , M f ) Δ n V g P n P i P f Stir to reach Release gas equilibrium M i M f V l Δ P = P f – P n M i P i  P n  Δ n Final equilibrium state Initial equilibrium state Non-equilibrium state  Number of moles of CO 2 increased in gaseous state = Number of moles of CO 2 decreased in liquid   PV - PV P f     g g n m slope = K RT RTV l  P f = K ‧Δ M + P i Δ M 6

  7. Procedure (I): Henry’s Law Constant When Air Is inside Bottle (P air + P CO2 ) P CO2 = 1.5~1.6 kg/cm 2 Stir to reach Release gas ~ 0.5 kg/cm 2 equilibrium P n , M i P f , M f P i , M i Final equilibrium state Initial equilibrium state Non-equilibrium state Equilibrium P 5 P i P 2 P 3 P 4 state M i M 2 M 3 M 4 M 5 Δ m 4 Δ m 3 Δ m 1 Δ m 2 Release gas Release gas Release gas Release gas ’ M 2 ’’ M 3 ’’’ M 4 P n M i P n P n P n Imbalanced state 7

  8. Procedure (II): Henry Law’s Constant without Air (P = P CO2 )  Continue using the above soda bottle, do not remove pressure gauge  Adding and releasing the bottle with CO 2 gas three times until all air is flushed out of the bottle  Repeat steps in procedure (I) P CO2 = 1.5~1.6 kg/cm 2 Release gas ca. ~0.5 kg/cm 2 Stir to reach equilibrium P n , M i P f , M f P i , M i Final equilibrium state Non-equilibrium state Initial equilibrium state 8

  9. Data Analysis Δ P Δ P Δ m Δ M P n P f (kg/cm 2 ) (kg/cm 2 ) (kg/cm 2 ) (atm) (mol/L) (mol/L) 1.00 1.30 0.30 0.29 -0.0045 -0.0045 P i 0.81 1.10 0.29 0.28 -0.0044 -0.0089 1.52 0.61 0.90 0.29 0.28 -0.0044 -0.0133 0.41 0.72 0.31 0.30 -0.0047 -0.0180 Δ P Δ P Δ m Δ M P n P f (kg/cm 2 ) (kg/cm 2 ) (kg/cm 2 ) (atm) (mol/L) (mol/L) 1.09 1.30 0.21 0.20 -0.0032 -0.0032 P i 0.81 1.18 0.37 0.36 -0.0056 -0.0088 1.59 0.71 1.08 0.37 0.36 -0.0056 -0.0144 0.60 0.95 0.35 0.34 -0.0053 -0.0196 9

  10. Data Analysis  Δ P (= P f – P n ) → Δ n → Δ m → Δ M (1) Unit for pressure gauge: kg/cm 2 , need to convert to atm when calculating Δ n (2) Δ m should be negative ( [CO 2 ] in water decreases)  Graph should include 2 regression lines to obtain 2 slopes for Henry law’s constant K 1 and K 2  K with positive value and unit: kg/cm 2 · M P f K 2 , CO 2 K 1 : Approx. 1 atm of air inside bottle (kg/cm 2 ) originally K 2 : Approx. 1 atm of CO 2 inside bottle K 1 , CO 2 +air originally, which means the bottle is completely filled with CO 2 , approaching △ M (mol/L) theoretical value 10

  11. Graph Obtained by Experiment For example: K 1 (Air+CO 2 ) = 43 kg/cm 2 ·M K 2 (CO 2 ) = 20 kg/cm 2 ·M 11

  12. Notice  Calibrate pressure gauge and avoid gas leak  Use 600-1000 mL plastic soda bottle  Do not use mineral water bottle (cannot withstand pressure)  If there is a gas leak, use soap water and apply to connecting areas to check for gas leak (ask for help from TA)  The unit on the pressure gauge is kgf/cm 2 equal to kg/cm 2  Record the room temperature of the day, Henry law’s constant changes with temperature  Recycle the soda bottle 12

Download Presentation
Download Policy: The content available on the website is offered to you 'AS IS' for your personal information and use only. It cannot be commercialized, licensed, or distributed on other websites without prior consent from the author. To download a presentation, simply click this link. If you encounter any difficulties during the download process, it's possible that the publisher has removed the file from their server.

Recommend


More recommend