
SLIDE 1
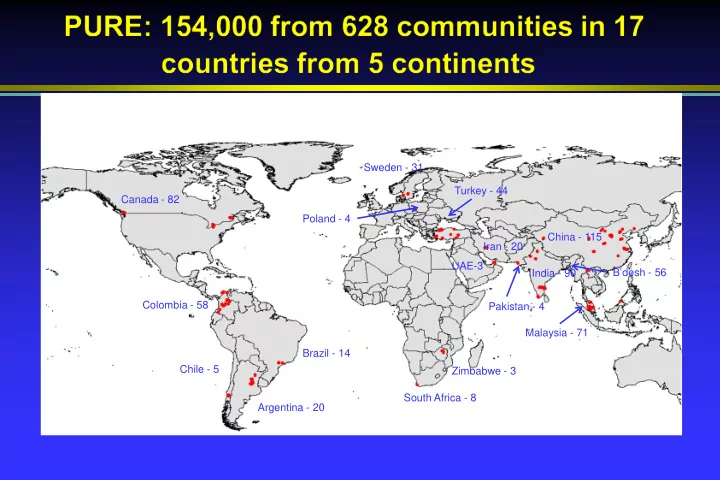
Canada - 82 Brazil - 14 Argentina - 20 Chile - 5 Colombia - 58 South Africa - 8 Zimbabwe - 3 India - 90 Pakistan - 4 B’desh - 56 Sweden - 31 Poland - 4 Turkey - 44 UAE-3 Iran - 20 China - 115 Malaysia - 71
Sweden - 31 Turkey - 44 Canada - 82 Poland - 4 China - 115 Iran - - PowerPoint PPT Presentation
Sweden - 31 Turkey - 44 Canada - 82 Poland - 4 China - 115 Iran - 20 UAE-3 Bdesh - 56 India - 90 Colombia - 58 Pakistan - 4 Malaysia - 71 Brazil - 14 Chile - 5 Zimbabwe - 3 South Africa - 8 Argentina - 20 Fruits and Vegetables
Canada - 82 Brazil - 14 Argentina - 20 Chile - 5 Colombia - 58 South Africa - 8 Zimbabwe - 3 India - 90 Pakistan - 4 B’desh - 56 Sweden - 31 Poland - 4 Turkey - 44 UAE-3 Iran - 20 China - 115 Malaysia - 71
10000 20000 30000 40000 50000 60000 200 400 600 800 1000 1200
Fruits and vegetables (grams/day)
Country GDP Fruits and vegetables (grams/day)
Zimbabw e Bangladesh Pakistan India China Colombia S.Africa Brazil Iran Turkey Malaysia Chile Argentina Poland Sw eden Canada UAE
Asset Index % energy from total fat 18 20 22 24 26 28
0.0 0.5 1.0 1.5 Mean and 95% CI for % energy from total fat
10000 20000 30000 40000 50000 60000 20 40 60 80 100
Total fat (grams/day)
Country GDP Total fat (grams/day)
Zimbabw e Bangladesh Pakistan India China Colombia S.Africa Brazil Iran Turkey Malaysia Chile Argentina Poland Sw eden Canada UAE
10000 20000 30000 40000 50000 60000 5 10 15 20 25 30
Saturated fat (grams/day)
Country GDP Saturated fat (grams/day)
Zimbabw e Bangladesh Pakistan India China Colombia S.Africa Brazil Iran Malaysia Chile Argentina Poland Sw eden Canada UAE
10000 20000 30000 40000 50000 60000 250 300 350 400 450 500
Carbohydrate (grams/day)
Country GDP carbohydrate (grams/day)
10000 20000 30000 40000 50000 60000 2000 3000 4000 5000 6000
Physcal activity (total METS score)
Country GDP Physcal activity (total METS score)
Zimbabw e Bangladesh Pakistan India China Colombia S.Africa Brazil Iran Turkey Malaysia Chile Argentina Poland Sw eden Canada UAE