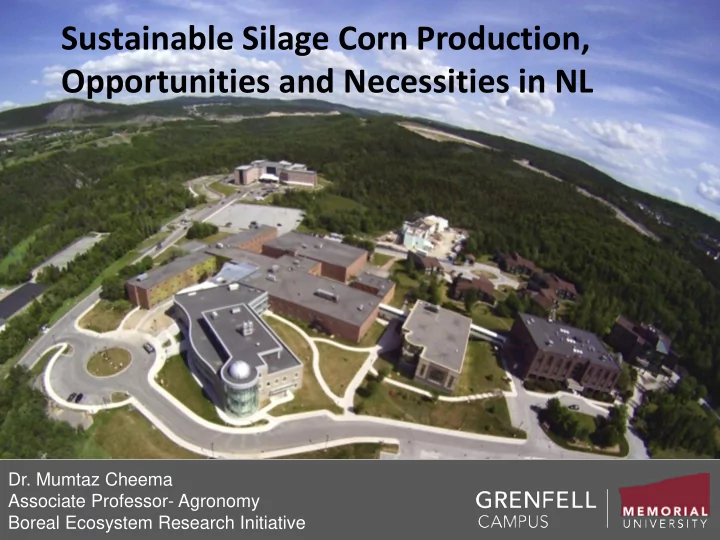

Sustainable Silage Corn Production, , Memorial University Opportunities and Necessities in NL Dr. Mumtaz Cheema Associate Professor- Agronomy Boreal Ecosystem Research Initiative
Sustainable silage corn production with dairy manure application
Pynn's Brook Research Station, Experimental Layout (2015) N 5 ft 5 ft 5 ft 5 ft W E 20.32 ft 20.32 ft 20.32 ft S 20.32 ft 20.32 ft P3 P2 P2 P1 P0 P1 P3 P2 P3 P1 R4 Soybean trial area Wheat trial area P0 P1 P3 P0 P3 P2 P0 P1 P0 P2 122 feet width P0 P2 P0 P1 P1 P0 P3 P2 P2 P3 R3 P3 P1 P2 P3 P2 P3 P1 P0 P1 P0 P3 P2 P1 P3 P1 P0 P2 P1 P0 P3 R2 P0 P1 P2 P0 P2 P3 P3 P0 P1 P2 P0 P2 P1 P2 P3 P0 P1 P0 P2 P0 R1 P1 P3 P0 P3 P2 P1 P2 P3 P1 P3 12 rows of sweet corn Variety 5 Variety 4 Variety 3 Variety 2 Variety 1 136 feet length Variety Variety Name CHU Company Trait Variety 1 Fusion RR 2 2200 Brett Young RR 2 Variety 2 Yukon R 2150 Brett Young RR 2 Variety 3 A4177G3 RIB 2175 Pride VT3/RR Variety 4 DKC-2317 RIB 2075 DEKLAB Variety 5 DKC26-28 RIB 2150 DEKLAB GENVT2P
Phosphorus treatments P 0 Control P (no P application) 30000 Lha -1 High P manure (0.6 kg P 2 O 5 /1000L) @ 40 L plot -1 P 1 Low P manure (0.3 kg P 2 O 5 /1000L) @ 40 L plot -1 30000 Lha-1 P 2 Inorganic P (0-45-0) @ 110 Kg ha -1 P 3 Parameters/Measurements Leaf area and leaf chlorophyll contents LI-3000C, and SPAD 502 plus Chlorophyll Meter In-situ root morphology with root scanner (CI 600) Gas exchange rates/photosynthesis with LI-6400XT Plant and soil sampling (P-uptake, root-shoot ratio, dry matter accumulation, soil sampling for root exudates) Greenhouse gas emission (Chambers) Biomass and plant height at final harvest Determining crude protein, acid detergent fiber (ADF), neutral detergent fiber (NDF), non-structural carbohydrates (NSC), total digestible nutrients (TDN), and ash content with FT-NIR Experiment details Seeding date June 4, 2015 89980 seeds ha -1 Seed rate Plot size 3m×4.40m Plot separation June 28, 2015 N application (kg ha -1 ) 90.72 P application (kg ha -1 ) 90.72 Weed control Glyphosate Harvest date Oct. 16, 2015 Experiment Design RCBD factorial
Silage Corn Seeding at Pynn’s Brook Research Station
Manure application
Installation of acrylic tubes
Installation of acrylic tubes
High resolution root scanning with CI-600
Mapping roots with Rootsnap (CI-690)
In Situ Root Imaging with Root Scanner
Leaf area and chlorophyll measurements
Greenhouse gas sampling
Sustainable Farming Community through sustainable silage corn following dairy manure Why manure as phosphorus source? -Food scarcity -Water scarcity -Why NOT debate on global phosphorus security? BECAUSE!
Manure is a renewable resource
Phosphorus is very much important Phosphorus (P) is vital to plant growth and is found in every living plant cell. It is involved in several key plant functions, including energy transfer, photosynthesis, transformation of sugars and starches, nutrient movement within the plant and transfer of genetic characteristics (DNA, RNA) from one generation to the next
• Stimulated root development • Increased stalk and stem strength • Improved flower formation and seed production • More uniform and earlier crop maturity • Increased nitrogen N-fixing capacity of legumes • Improvements in crop quality • Increased resistance to plant diseases.
A Mohr & Evans (2013) B Cordell et al. (2009), Cordell & White (2011) C GPRI (2010), Cordell et al. (2011 D Walan (2013) CD E Fixen (2009) F Kauwenbergh (2010) A B F E 2311 – 2411 2011 2025 2033 2070 2084 2102 Global phosphate depletion scenarios by different authors, indicating different depletion or peak years based on different assumptions[Studies depicted are Mohr & Evans 2013; Cordell et al. and Cordell & White 2011; GPRI 2010, Cordell et al. 2011; Walan 2013; Fixen 2009; Kauwenbergh 2010]
Global P consumption and reserves Cordell et al. 2009 IFA, 2008 IFDC 2010
Key phosphorus flows through the global food production and consumption system, indicating phosphorus usage, losses and recovery at each key stage of the process. Units are in Million tons/year. IFA, 2006 IFA (2006) and Smil (2000a,b)
What are the key options? To reduce the significant losses occur throughout the system — from mining to field to fork, ( mining five times the amount of phosphorus that humans are actually consuming in food) Alternative renewable phosphorus sources, o manure (around 15 MT P), o human excreta (3 MT P) and o food residues (1.2 MT P),
A preferred scenario for meeting long-term global phosphorus demand: integrated demand management (efficiency) measures (blue) and supply-side (reuse) measures (red). Cordell and White, 2013
THANKS Research Team Dr. Nadeem (Post-doc) Dr. Unc (Soil Science-BERI) Dr. Galagedara (Hydrology and Water Resources-BERI) Dr. Thomas (Plant Science-BERI) Dr. Kavanagh (Scientist-Forestry & Agrifoods Agency)
Recommend
More recommend