supplementary information for 2009 strategy presentation
play

Supplementary Information for 2009 Strategy presentation The - PDF document

Supplementary Information for 2009 Strategy presentation The information below has been provided to enhance understanding of the terminology and performance measures that have been used in the accompanying presentations. Group Measures:


  1. Supplementary Information for 2009 Strategy presentation The information below has been provided to enhance understanding of the terminology and performance measures that have been used in the accompanying presentations. Group Measures: 
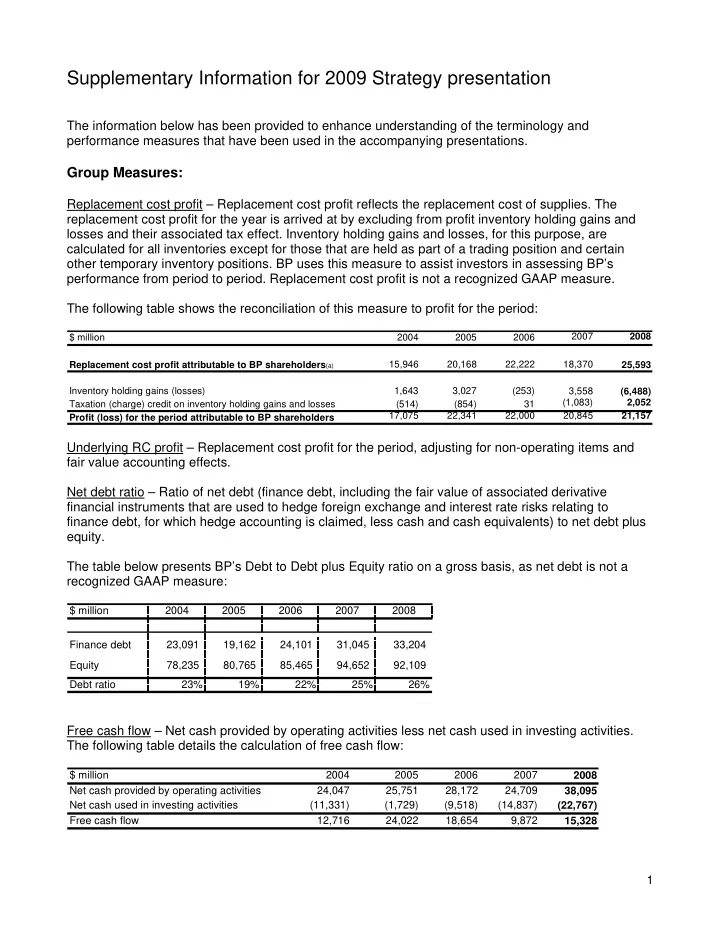
Replacement cost profit – Replacement cost profit reflects the replacement cost of supplies. The replacement cost profit for the year is arrived at by excluding from profit inventory holding gains and losses and their associated tax effect. Inventory holding gains and losses, for this purpose, are calculated for all inventories except for those that are held as part of a trading position and certain other temporary inventory positions. BP uses this measure to assist investors in assessing BP’s performance from period to period. Replacement cost profit is not a recognized GAAP measure. The following table shows the reconciliation of this measure to profit for the period: 2007 2008 $ million 2004 2005 2006 Replacement cost profit attributable to BP shareholders (a) 15,946 20,168 22,222 18,370 25,593 Inventory holding gains (losses) 1,643 3,027 (253) 3,558 (6,488) (1,083) 2,052 Taxation (charge) credit on inventory holding gains and losses (514) (854) 31 17,075 22,341 22,000 20,845 21,157 Profit (loss) for the period attributable to BP shareholders Underlying RC profit – Replacement cost profit for the period, adjusting for non-operating items and fair value accounting effects. Net debt ratio – Ratio of net debt (finance debt, including the fair value of associated derivative financial instruments that are used to hedge foreign exchange and interest rate risks relating to finance debt, for which hedge accounting is claimed, less cash and cash equivalents) to net debt plus equity. The table below presents BP’s Debt to Debt plus Equity ratio on a gross basis, as net debt is not a recognized GAAP measure: $ million 2004 2005 2006 2007 2008 Finance debt 23,091 19,162 24,101 31,045 33,204 Equity 78,235 80,765 85,465 94,652 92,109 26% Debt ratio 23% 19% 22% 25% Free cash flow – Net cash provided by operating activities less net cash used in investing activities. The following table details the calculation of free cash flow: $ million 2004 2005 2006 2007 2008 Net cash provided by operating activities 24,047 25,751 28,172 24,709 38,095 Net cash used in investing activities (11,331) (1,729) (9,518) (14,837) (22,767) Free cash flow 12,716 24,022 18,654 9,872 15,328 1

  2. Inorganic capital expenditure (Inorganic Capex) is equal to acquisitions and asset exchanges plus, for 2006, our investment in Rosneft and for 2008, the capital expenditure relating to our transactions with Husky and Chesapeake. Organic capital expenditure (Organic Capex) is equal to total capital expenditure and acquisitions less inorganic capital expenditure. Capital employed – Net assets plus finance debt. Cash costs – Cash costs are a subset of total costs. They exclude non-cash items such as depreciation, depletion and amortization and impairment and losses on sales of businesses and fixed assets. We define cash costs as Production and manufacturing expenses plus Distribution and administration expenses less certain costs that are variable with volumes (such as freight costs). They represent the substantial majority of the expenses in these line items and are the operating and overhead costs that are most directly under management control. Exploration and Production: Production – Crude oil, natural gas liquids (NGL) and natural gas produced from consolidated operations, and BP’s interest in joint ventures and associates. Converted to barrels of oil equivalent (boe) at 1 barrel of NGL = 1 boe and 5,800 standard cubic feet of natural gas = 1 boe. Historical volumes shown are as previously reported. Projections reflect indications, not targets. This is not an amount that can be targeted, nor is it a specific forecast for a year. Proved oil and gas reserves – Proved oil and gas reserves are the estimated quantities of crude oil, natural gas, and natural gas liquids which geological and engineering data demonstrate with reasonable certainty to be recoverable in future years from known reservoirs under our existing economic and operating conditions, i.e. prices and costs as of the date the estimate is made. Prices include consideration of changes in existing prices provided only by contractual arrangements, but not on escalations based upon future conditions. Proved developed reserves – Proved reserves that can be expected to be recovered through existing wells with existing equipment and operating methods. Additional oil and natural gas expected to be obtained through the application of fluid injection or other improved recovery techniques for supplementing the natural forces and mechanisms of primary recovery are included as ‘proved developed reserves’ only after testing by a pilot project or after the operation of an installed programme has confirmed through production response that increased recovery will be achieved. Proved undeveloped reserves – Proved reserves that are expected to be recovered from new wells on undrilled acreage, or from existing wells where a relatively major expenditure is required for recompletion. Reserves on undrilled acreage shall be limited to those drilling units offsetting productive units that are reasonably certain of production when drilled. Proved reserves for other undrilled units are claimed only where it can be demonstrated with certainty that there is continuity of production from the existing productive formation. Under no circumstances are estimates for proved undeveloped reserves attributable to any acreage for which an application of fluid injection or other improved recovery technique is contemplated, unless such techniques have been proved effective by actual tests in the area and in the same reservoir. Non-proved reserves are not recognized for SEC purposes. 2

  3. Reserve replacement ratio – The ratio of reserves booked through discoveries, extensions, net revisions and improved recovery to production for the period. This measure excludes the effects of acquisitions and disposals. Unless stated otherwise, this ratio is based on a combined basis which includes both subsidiaries and equity-accounted entities, excluding acquisitions and disposals and is based on reserves estimated in accordance with the SEC rules and relevant guidance and using the price on 31 December 2008. The main marker prices used were $36.545/bbl Brent and $44.61/bbl WTI (oil) and $5.63/mmBtu Henry Hub (natural gas). Resources – Total resources are the estimated quantities of crude oil, natural gas and natural gas liquids likely to be produced in the fullness of time from fields in which BP has current entitlement. The estimation, categorization and progression of total resources is founded on a discrete deterministic base case informed by interpretation and integration of the relevant data. Total resources are divided into non-proved resources and committed resources and are evaluated using BP economic case criteria for prices and costs. Resources replacement ratio: The ratio of resources booked through discoveries, extensions, net revisions and improved recovery to production for the period. This measure excludes the effects of acquisitions and disposals. Unless stated otherwise, this ratio is based on a combined basis which includes both subsidiaries and equity-accounted entities, excluding acquisitions and disposals. Refining and Marketing: Global Indicator Margin (GIM) – The Global Indicator Refining Margin is the average of regional indicator margins weighted for BP’s crude refining capacity in each region. Each regional indicator margin is based on a single representative crude with product yields characteristic of the typical level of upgrading complexity. The regional indicator margins may not be representative of the margins achieved by BP in any period because of BP’s particular refinery configurations and crude and product slate. Performance gap: The ‘performance gap’ is the estimated difference between BP's R&M segment pre- tax replacement cost profit and the nearest comparative earnings measure of our leading competitors, adjusted to a GIM of $7.50/bbl. Operating capital employed – Capital employed as defined in Group measures, excluding liabilities for current and deferred taxation. BP publishes segment results on a pre-tax basis and publishes operating capital employed for each segment. Underlying return on average capital employed (ROACE) • Numerator – Replacement cost profit for the period, adjusted for non-operating items, fair value accounting effects and the depreciation of the fixed asset revaluation adjustment consequent on the ARCO acquisition. The numerator is tax effected using the BP group effective tax rate. • Denominator – Capital employed, which equals operating capital employed (excluding goodwill), adjusted for the revaluation adjustment consequent on the ARCO acquisition, and including liabilities for current and deferred taxation, allocated on the basis of the segment’s relative percentage of the group’s operating capital employed. 3

Download Presentation
Download Policy: The content available on the website is offered to you 'AS IS' for your personal information and use only. It cannot be commercialized, licensed, or distributed on other websites without prior consent from the author. To download a presentation, simply click this link. If you encounter any difficulties during the download process, it's possible that the publisher has removed the file from their server.

Recommend


More recommend