
SLIDE 1
8 October 2020
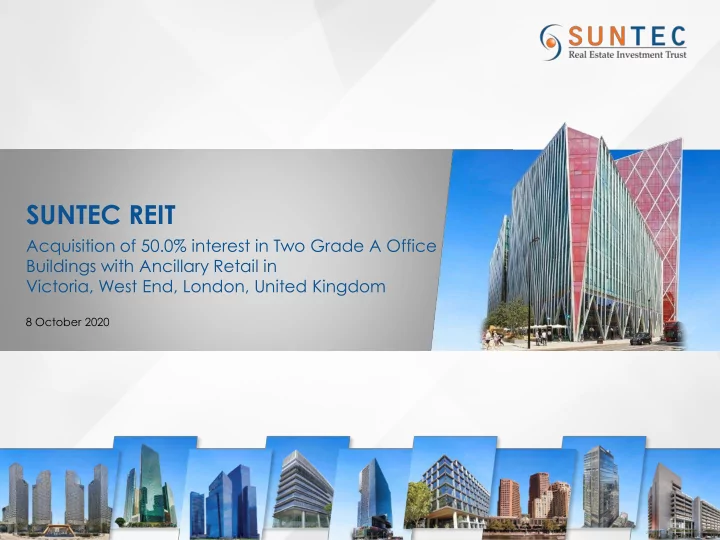
SUNTEC REIT Acquisition of 50.0% interest in Two Grade A Office - - PowerPoint PPT Presentation
SUNTEC REIT Acquisition of 50.0% interest in Two Grade A Office Buildings with Ancillary Retail in Victoria, West End, London, United Kingdom 8 October 2020 Content 29 3 Unitholders Approval and Timeline Acquisition Overview 32 7
8 October 2020
2
4
3
Notes:
1 Based on 50.0% interest and exchange rate of £1 : S$1.78 2 Based on passing income as at 30 June 2020 divided by total acquisition cost of £439.4 million (approximately S$782.1 million). 3 Illustrative DPU accretion based on passing income as at 30 June 2020 compared with actual annualised 1H2020 DPU (before retention of 10.0% distribution) 4 Based on net lettable area as at 30 June 2020
Description Nova North, Nova South and The Nova Building1 (“Nova Properties”) Title Leasehold expiring on 27 April 3062 (1,042 years remaining) Year of Completion 2016/2017 Agreed Property Value2 £430.6 mil (S$766.5 mil) (1.2% discount to independent valuation3 of £436.0 mil (S$776.1 mil) NPI Yield 4.6%4 Developer/Asset Manager Land Securities (“Landsec”) Sustainability Office BREEAM rating ‘Very Good’5 Retail BREEAM rating ‘Good’5
Notes:
1 The Nova Building consists of retail units on the ground floor and 170 residential units. While the acquisition includes the ground lease in relation to the residential units, the
170 residential units are excluded from the transaction.
2 Based on 50.0% interest and exchange rate of £1 : S$1.78 3 Independent valuation conducted by Jones Lang LaSalle Limited dated 1 September 2020 4 Based on passing income as at 30 June 2020 divided by total acquisition cost 5 BREEAM (Building Research Establishment Environmental Assessment Method) provides independent certification of the sustainability performance of buildings 6 Based on 100% interest 7 Based on net lettable area as at 30 June 2020
5
Tenancy Information6 Office Retail Total Net Lettable Area (“NLA”) (sq ft) 480,292 (85.9%) 78,811 (14.1% ) 559,103 (100%) Committed Occupancy7 100% 100% 100%
17 18 35 Weighted Average Lease Expiry (“WALE”) (Years)7 10.6 14.1 11.1
6
Distinctive Design Contemporary Office Lobby Column Free Floor Plates Variety of Retail Offerings
Sources: JLL Research dated September 2020 and Statista
8
Source: JLL Research dated September 2020
9
2009-2024E
60 70 80 90 100 110 120 130 2009 Q1 2009 Q3 2010 Q1 2010 Q3 2011 Q1 2011 Q3 2012 Q1 2012 Q3 2013 Q1 2013 Q3 2014 Q1 2014 Q3 2015 Q1 2015 Q3 2016 Q1 2016 Q3 2017 Q1 2017 Q3 2018 Q1 2018 Q3 2019 Q1 2019 Q3 2020 Q1 2020 Q3 (f) 2021 Q1 (f) 2021 Q3 (f) 2022 Q1 (f) 2022 Q3 (f) 2023 Q1 (f) 2023 Q3 (f) 2024 Q1 (f) 2024 Q3 (f)2009-2024E
10 Source: JLL Research dated September 2020
Prime Rents to Improve in the Medium Term Underpinned by Limited New Supply and Recovery of Economy Vacancy Rate to Remain Stable due to Limited New Supply
(£/sq ft per annum)
0.0% 2.0% 4.0% 6.0% 8.0% 10.0% 12.0% 14.0% 2009 2011 2013 2015 2017 2019 2021E 2023E West End City East London Central London 10-year average 20 40 60 80 100 120 140 2009 2011 2013 2015 2017 2019 2021E 2023E West End City East London West End 10-year average
11
Source: JLL Research dated September 2020
Green marketing is a practice whereby companies seek to go above and beyond traditional marketing by promoting. Green marketing is a practice whereby companies seek to go above and beyond traditional marketing by promoting. Green marketing is a practice whereby companies seek to go above and beyond traditional marketing by promoting.
YOUR TITLE 02
Green marketing is a practice whereby companies seek to go above and beyond traditional marketing by promoting.
YOUR TITLE 02
4.8% 4.6% 4.0% 4.0% 3.4% 3.3% 3.0% 2.9% 2.8% 2.7%
East London Nova Properties West End City Madrid Stockholm Amsterdam Frankfurt Paris Berlin Prime office yield Respective country's 10-year govt. bond yield
12
Notes:
1 Based on passing income, expressed as a percentage of capital value, after adding notional purchaser’s costs 2 Based on passing income as at 30 June 2020 divided by total acquisition cost 3 Based on property transactions which were more than £125 mil in value
Source: JLL Research dated September 2020
London
3 2
Source: JLL Research dated September 2020
13
Property Transaction Date Size (sq ft) Price (£ mil) Capital Value (£ psf) Yield1 Year of Building Completion / Major Refurbishment
Nova Properties, Victoria, SW1 (the Acquisition) 2020 Q4 559,103 430.6 (50.0% interest) 1,540 4.6%2 2016/2017 Sanctuary Buildings, SW1, West End 2020 Q1 225,428 300.0 1,331 4.0% Major refurbishment completed in 2009 The Post Building, WC1, West End 2019 Q4 302,300 607.5 2,011 4.0% 2019 1 New Oxford Street, WC1, West End 2020 Q3 109,300 173.0 1,583 4.2% Major refurbishment completed in 2017 25 Cabot Square, E14, Canary Wharf 2020 Q3 481,605 380.0 790 4.6% Major refurbishment completed in 2020
Notes:
1 Based on passing income, expressed as a percentage of capital value, after adding notional purchaser’s costs 2 Based on passing income as at 30 June 2020 divided by total acquisition cost
15
Note:
1 Illustrative DPU accretion based on passing income as at 30 June 2020 compared with actual annualised 1H2020 DPU (before retention of 10.0% distribution)
16
Strategically located
Victoria Station:
railway station in the UK
for London Underground network and Victoria Coach station
link to Gatwick Airport
Buckingham Palace St James’s Park City of London The Houses of Parliament Nova South Nova North The Nova Building
Entrances to London Underground
17 Note:
1 Based on committed monthly gross rental income as at 30 June 2020 2 WALE to Break of 10.0 years
7.9% 17.7% 11.8% 27.8% 20.7% 0.4% 3.3% 10.4% 2020 - 2026 2027 2028 2029 2030 2031 2032 & beyond Office Retail
Office 89.6% Retail 10.4%
Strong Office Income Stream Long WALE of 11.1 years to Expire2
0% 0%
18
Consultancy / Services, 25.7% Energy and Natural Resources, 22.4% Technology, media and telecommunications, 16.2% Trading & Investments, 12.8% Real Estate and Property Services, 11.2% Government and Government-Linked Offices, 9.8% Others, 1.9%
Note:
1 Based on committed monthly gross office rental income as at 30 June 2020
% of Gross Rental Income Atkins 11.2 The Argyll Club 10.0 Government 8.8 Vitol 8.5 BlueCrest 6.2 Reply Limited 5.4 Advent International 5.2 BHP Billiton 5.2 Egon Zehnder 5.0 L.E.K. Consulting 5.0 Top 10 Tenants Total 70.5 Other Tenants (Office) 19.1 Other Tenants (Retail) 10.4 Grand Total 100
Non-Reliance on any Single Sector
Restaurant 33.5% Café 22.7% Bar 17.9% Fastfood 7.2% Entertainment 12.4% Gym 6.3%
19
Note:
1 Based on committed monthly gross retail rental income as at 30 June 2020
2-year Guarantee on Retail Income
20
7.31 7.31 7.67 1H2020 Annualised DPU Enlarged Portfolio
2
Capital Management Key Drivers
0.36
1
Notes:
1 Before retention of 10.0% distribution 2 Illustrative DPU accretion based on passing income as at 30 June 2020 compared with actual annualised 1H2020 DPU (before retention of 10.0% distribution) 3 Based on passing income as at 30 June 2020 divided by total acquisition cost 4 Generally every five years at market or existing rent, whichever is the higher
DPU Accretion of 4.9%
Singapore 77.2% Australia 16.1% United Kingdom 6.7%
Enlarged Portfolio1
Singapore 82.8% Australia 17.2%
Existing Portfolio1
21 Note:
1 As at 30 June 2020, including the additional capital injection in Suntec Singapore and the completion value of 477 Collins Street
2.3 2.8 Existing Enlarged 4.0 4.4 Existing Enlarged
22 Note:
1 Based on the NLA of Suntec REIT’s interests in its respective properties as at 30 June 2020
23
Existing Portfolio1 Enlarged Portfolio1,2
Notes:
1 Refers to Net Property Income and Income Contribution from Joint Ventures for 1H2020 2 Assumes Suntec REIT owns the property from 1 January 2020 to 30 June 2020
Suntec City 43.0% Suntec Singapore 0.5% One Raffles Quay 8.0% MBFC Properties 16.9% 177 Pacific Highway 10.3% Southgate Complex 5.3% 55 Currie Street 3.7% 21 Harris Street 1.2% Nova 11.1%
Suntec City 48.5% Suntec Singapore 0.5% One Raffles Quay 9.0% MBFC Properties 19.1% 177 Pacific Highway 11.5% Southgate Complex 5.9% 55 Currie Street 4.1% 21 Harris Street 1.4%
3.4% 3.2% 1.9% 1.9% 1.9% 1.7% 1.6% 1.6% 1.6% 1.4% 3.1% 2.9% 1.8% 1.7% 1.7% 1.5% 1.5% 1.5% 1.4% 1.3%
Pre acquisition Post acquisition
20.2% 18.4% Existing Enlarged
24
Standard Chartered Bank UBS AG CIMIC Publicis Groupe TPG Telecom Limited Barclays Singapore PayPal Deutsche Bank Commonwealth
Ernst & Young
Notes:
1 Based on total committed monthly gross rental income of Suntec REIT’s top 10 tenants as at 30 June 2020 2 Based on Suntec REIT’s interests in its respective properties as at 30 June 2020
25 Note:
1 As at 31 March 2020
27
Note: 1 Based on the unit trusts’ net asset value taking into account agreed property value of £430.6 mil, subject to completion adjustments. 2 Based on exchange rate of £1 : S$1.78
28
41.3 45.22,3
Existing Enlarged
2.09 2.093
Existing Enlarged
Notes:
1 As at 30 June 2020 2 Debt Headroom of approx. S$1,130 mil to reach ALR of 50.0% 3 Based on £200 mil GBP denominated loans and up to S$417.9 mil SGD denominated loans
1 1
30
Note:
1 Refers to Paragraph 6.5(b)(ix) of Appendix 6 in the Code on Collective Investment Schemes
31
32
33
The information included in this release does not constitute an offer or invitation to sell or the solicitation of an offer or invitation to purchase or subscribe for units in Suntec REIT (“Units”) in Singapore or any other jurisdiction. This presentation may contain forward-looking statements that involve assumptions, risks and uncertainties. Actual future performance, outcomes and results may differ materially from those expressed in forward-looking statements as a result of a number of risks, uncertainties and assumptions. Representative examples of these factors include (without limitation) general industry and economic conditions, interest rate trends, cost of capital and capital availability, competition from other developments or companies, shifts in the expected levels of occupancy rates, property rental income, changes in operating expenses, property expenses and governmental and public policy changes and the continued availability of financing in the amounts and the terms necessary to support future business. Past performance is not necessarily indicative of future performance. Predictions, projections or forecasts of the economy or economic trends of the markets are not necessarily indicative of the future or likely performance of Suntec REIT. You are cautioned not to place undue reliance on these forward- looking statements, which are based on the current view of management on future events. IMPORTANT NOTICE
guaranteed by, ARA Trust Management (Suntec) Limited (as the manager of Suntec REIT) (the “Manager”) or any of its affiliates. An investment in Units is subject to investment risks, including the possible loss of the principal amount invested.
Units are listed on the SGX-ST. It is intended that holders of Units may only deal in their Units through trading on the SGX-ST. The listing of the Units on the SGX-ST does not guarantee a liquid market for the Units.
34
5 Temasek Boulevard, #12-01, Suntec Tower 5 Singapore 038985 Tel: +65 6835 9232 Fax: +65 6835 9672 www.suntecreit.com www.ara-group.com
35
Inward FDI flows
2015 and 2019: One of the top recipients in Europe
0.0 0.2 0.4 0.6 0.8 1.0
United Kingdom Luxembourg Ireland Spain Russia
Sources: JLL Research dated September 2020 and Statista
2019 2018 2017 2016 2015 (USD trillion)
GDP of Top 10 Europe Economies
UK economy forecasted to remain the 2nd largest in Europe
(USD billion) 2019A Real GDP 2024E Real GDP 500 1,000 1,500 2,000 2,500 3,000 3,500 4,000 4,500
16 – 24 9.9% 25 – 34 29.3% 35 – 49 35.7% 50 – 64 22.1% > 65 3.0% 36
Unemployment Rate
UK labour market conditions, prior to COVID-19 crisis, were very positive. Unemployment was at four decade low.
Demographics
Young and dynamic workforce with 65% between 25 and 49 years old
Source: JLL Research dated September 2020 Note:
1 Based on forecasts by Consensus Economics
5.7% 5.1% 4.7% 4.3% 3.9% 3.9% 6.5%1 7.3%1 0.0% 3.0% 6.0% 9.0% 12.0% 15.0% 2014 2015 2016 2017 2018 2019 2020E 2021E Unemployment Rate 10-Year average
Source: JLL Research dated September 2020
37
London Ranks Among Top 10 Across Many Key Aspects 1 New York 2 London 3 Beijing 4 Tokyo 5 Zurich 6 Singapore 7 San Francisco 8 Sydney 9 Hong Kong 10 Toronto Economy Research & Development Cultural Interaction Accessibility 1 New York 2 London 3 Tokyo 4 Los Angeles 5 Seoul 6 Boston 7 Chicago 8 San Francisco 9 Paris 10 Hong Kong 1 London 2 New York 3 Paris 4 Tokyo 5 Singapore 6 Dubai 7 Berlin 8 Bangkok 9 Seoul 10 Moscow 1 Paris 2 London 3 New York 4 Shanghai 5 Frankfurt 6 Amsterdam 7 Hong Kong 8 Tokyo 9 Dubai 10 Singapore
38
Source: JLL Research dated September 2020
CBD Office Stock Office Leasing Demand
Largest Amongst Key European Cities Demand Supported by London’s Attractiveness as Global Hub
(‘000 Sq ft) 2 4 6 8 10 12 14
2009 2010 2011 2012 2013 2014 2015 2016 2017 2018 2019 2020E 2021E 2022E 2023E 2024E
(Mil Sq ft) City West End East London Central London 10 year average
100,000 150,000 200,000 250,000
Source: JLL Research dated September 2020
39
London Office Take-Up by Sector
31% 25% 20% 20% 16% 13% 13% 14% 11% 2% 4% 16%
11% 22% 22%
7% 8% 5% 10% 8% 11%
6% 3% 2%
0% 10% 20% 30% 40% 50% 60% 70% 80% 90% 100% 2004 – 2008 2009 – 2013 2014 – 2019 Banking & Finance Professional Service Flexible Workspaces TMT Manufacturing Public Admin Other
Demand Driven by Diversified Key Sectors including Services, Banking and Finance and TMT