
SLIDE 1
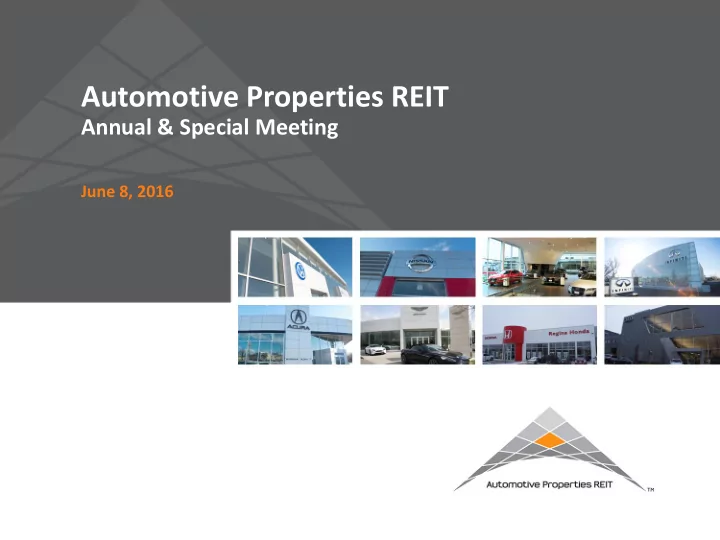
Automotive Properties REIT
Annual & Special Meeting
June 8, 2016
Automotive Properties REIT Annual & Special Meeting June 8, - - PowerPoint PPT Presentation
Automotive Properties REIT Annual & Special Meeting June 8, 2016 AUTOMOTIVE PROPERTIES REIT ANNUAL & SPECIAL MEETING Milton Lamb President & Chief Executive Officer 2 AUTOMOTIVE PROPERTIES REIT ANNUAL & SPECIAL MEETING Kap
Automotive Properties REIT
Annual & Special Meeting
June 8, 2016
Milton Lamb
President & Chief Executive Officer
2
AUTOMOTIVE PROPERTIES REIT ANNUAL & SPECIAL MEETING
Kap Dilawri
Chair of the Board
3
AUTOMOTIVE PROPERTIES REIT ANNUAL & SPECIAL MEETING
AGENDA
4
Milton Lamb
President & Chief Executive Officer
5
AUTOMOTIVE PROPERTIES REIT ANNUAL & SPECIAL MEETING
DISCLAIMER
FORWARD-LOOKING STATEMENTS Certain statements contained in this presentation constitute forward-looking information within the meaning of securities laws. Forward-looking information may relate to the REIT’s future outlook and anticipated events or results and may include statements regarding the financial position, business strategy, budgets, litigation, projected costs, capital expenditures, financial results, taxes, plans and objectives of or involving the REIT. Particularly, statements regarding future results, performance, achievements, prospects or opportunities for the REIT or the real estate or automotive dealership industry are forward-looking
affect its financial condition, results of operations, business strategy and financial needs, including that the Canadian economy will remain stable over the next 12 months, that inflation will remain relatively low, that interest rates will remain stable, that tax laws remain unchanged, that conditions within the automotive dealership real estate industry and the automotive dealership industry generally, including competition for acquisitions, will be consistent with the current climate, that the Canadian capital markets will provide the REIT with access to equity and/or debt at reasonable rates when required and that the Dilawri Organization will continue its involvement with the REIT. Although the forward-looking statements contained in this presentation are based upon assumptions that management believes are reasonable based on information currently available to management, there can be no assurance that actual results will be consistent with these forward-looking statements. Forward-looking statements necessarily involve known and unknown risks and uncertainties, many of which are beyond the REIT’s control, that may cause the REIT’s or the industry’s actual results, performance, achievements, prospects and opportunities in future periods to differ materially from those expressed or implied by such forward-looking statements. The forward-looking statements made in this presentation relate only to events or information as of the date of this presentation. Except as required by law, the REIT and Dilawri undertake no obligation to update or revise publicly any forward-looking statements, whether as a result of new information, future events or otherwise, after the date on which the statements are made or to reflect the occurrence of unanticipated events. Please refer to “Forward-Looking Statements” in the REIT’s regulatory filings. NON-IFRS MEASURES This presentation makes reference to certain non-IFRS measures. Funds from operations (‘‘FFO’’), adjusted funds from operations (‘‘AFFO’’), net operating income (‘‘NOI’’) and cash net operating income (‘‘Cash NOI’’) are key measures of performance used by real estate businesses. However, such measures are not defined by IFRS and do not have standardized meanings prescribed by IFRS. The REIT believes that AFFO is an important measure of economic performance and is indicative of the REIT’s ability to pay distributions, while FFO, NOI and Cash NOI are important measures of operating performance and the performance of real estate properties. The IFRS measurement most directly comparable to FFO, AFFO, NOI and Cash NOI is net income. Please refer to “Non-IFRS Measures” in the REIT’s regulatory filings.
6
AUTOMOTIVE PROPERTIES REIT IPO
from the Dilawri Group
7
corridors
INITIAL PROPERTIES
GVA Calgary Regina Edmonton GTA Montréal
8 GTA
8 Properties
REGINA
8 Properties
CALGARY
4 Properties
GVA
6 Properties
COMPELLING INDUSTRY FUNDAMENTALS
Source: Statistics Canada and DesRosiers Automotive Consultants Inc.Canadian Automotive Retail Industry Sales ($ billions)
9
REPRESENTING 6.5% OF 2015 GDP, THE AUTOMOTIVE RETAIL SALES INDUSTRY IS CANADA’S LARGEST RETAIL SEGMENT
53 56 64 65 70 74 78 83 83 83 87 92 96 94 88 96 100 105 112 120 128
1995 1996 1997 1998 1999 2000 2001 2002 2003 2004 2005 2006 2007 2008 2009 2010 2011 2012 2013 2014 2015 Company Dealerships % of Total Dealership Locations Dilawri Group(1)(2) 58 1.7% QC, ON, SK, AB, BC AutoCanada(1) 53 1.5% NS, NB, QC, ON, MB, SK, AB, BC Go Auto(1)(2)(3) 37 1.1% AB, BC, NWT Zanchin Automotive Group(1) 28 0.8% ON Gabriel-Prestige-President Group(1) 27 0.8% QC Humberview Group(1) 27 0.8% ON O’Regan Group(1) 26 0.7% NS Pattison Auto Group(1) 25 0.7% MB, AB, BC Murray Auto Group(1) 25 0.7% NS, MB, SK, AB, BC Wheaton Auto Group(1) 16 0.5% SK, AB, BC Top 10 subtotal 322 9.3% Other 3,154 90.7% Total 3,469(4) 100.0%
10
(1) Information based on publicly available information as at May 20, 2016. (2) Denotes current tenants of the REIT (3) Excludes collision centres and RV/Marine dealerships (4) Source: DesRosiers Automotive Consultants Inc.10 DEALERSHIP GROUPS: ONLY 9.3% OF MARKET
THE AUTOMOTIVE DEALERSHIP INDUSTRY IS HIGHLY FRAGMENTED AND NOW CONSOLIDATING
65% owned by individuals or small dealer groups
PARTNERING WITH AUTOMOTIVE PROPERTIES REIT
11
PROVIDING FINANCIAL LIQUIDITY TO AUTOMOTIVE DEALERSHIP OWNERS TO SUPPORT THE ADVANCEMENT OF THEIR STRATEGIC OBJECTIVES
Established Dealers Industry Consolidators
asset class
development and acquisition pipeline
average, opened or acquired five new dealerships per year, including two to three dealership properties
$930 $1,016 $1,324 $1,641 $2,000
2011 2012 2013 2014 2015
12
ATTRACTIVE PIPELINE OF ACQUISITION OPPORTUNITIES FROM THE DILAWRI GROUP Dilawri 5-Year Historical Revenues ($millions)
EBITDAR $58 $65 $81 $100 $108
STRATEGIC ALLIANCE WITH THE DILAWRI GROUP
17% CAGR
ADVANCING THE REIT’S ACQUISITION PROGRAM
Toyota Woodland (Montreal, Quebec)
13
ACCRETIVE ACQUISTIONS ENHANCE BRAND, GEOGRAPHIC AND TENANT DIVERSIFICATION, WHILE EXTENDING WEIGHTED AVERAGE PORTFOLIO LEASE TERM Audi Barrie (Innisfil, Ontario)
Porsche Centre and Jaguar Land Rover Edmonton (Edmonton, Alberta)
Entry into Canada’s 2nd largest urban market 1st transaction with third- party dealership tenant Acquisition of first Dilawri Development Property
14
acres
PORTFOLIO TODAY
GVA Calgary Regina Edmonton GTA & Barrie Montréal
diversification
Andrew Kalra
Chief Financial Officer
15
AUTOMOTIVE PROPERTIES REIT ANNUAL & SPECIAL MEETING
2015 FINANCIAL REVIEW1,2 (163-DAY PERIOD ENDED DEC. 31, 2015)
16
13,241 13,300 Adjusted Forecast Actual
Revenue
8,049 8,054 Adjusted Forecast Actual
FFO
($thousands)
6,871 6,875 Adjusted Forecast Actual
AFFO
(1) The REIT generated an additional $5,828 of net proceeds as a result of the underwriters’ partial exercise of the over-allotment option granted at the time of the IPO, resulting in an additional 620,000 of REIT Units outstanding. (2)The Financial Forecast, included in the REIT’s IPO prospectus for the 12-month period ended June 30, 2016, assumed a full six months of operations for the period ended December 31, 2015. However, the REIT did not commence operations until July 22, 2015. In order to facilitate comparison with actual results, the Financial Forecast has been adjusted (the “Adjusted Forecast”) to reflect the 163-day period from the closing of the REIT’s IPO on July 22, 2015 to December 31, 2015 (the “Operating Year”). ($thousands) ($thousands) ($thousands)
Adjusted Forecast Actual
NOI & Cash NOI
11,507 10,381 10,410 11,566
2015 CASH DISTRIBUTIONS (163-DAY PERIOD ENDED DEC. 31, 2015)
17
AFFO Payout Ratio
For the Operating Year ended December 31, 20151,2
Actual Adjusted Forecast Distributions per unit $0.357 $0.357 AFFO per unit $0.381 $0.381 AFFO payout ratio 93.7% 93.7%
$
Total Distributions Declared to Unitholders for the 2015
(1) The REIT generated an additional $5,828 of net proceeds as a result of the underwriters’ partial exercise of the over-allotment option granted at the time of the IPO, resulting in an additional 620,000 of REIT Units outstanding. (2)The Financial Forecast, included in the REIT’s IPO prospectus for the 12-month period ended June 30, 2016, assumed a full six months of operations for the period ended December 31, 2015. However, the REIT did not commence operations until July 22, 2015. In order to facilitate comparison with actual results, the Financial Forecast has been adjusted (the “Adjusted Forecast”) to reflect the 163-day period from the closing of the REIT’s IPO on July 22, 2015 to December 31, 2015 (the “Operating Year”).
Q1 2016 FINANCIAL REVIEW1,2
18
(1) Includes the 26 Initial Properties from the IPO, and the properties subsequently acquired (Toyota Woodland, Porsche JLR Edmonton, and Audi Barrie). (2) The REIT’s financial forecast that was included in its IPO prospectus (the “Financial Forecast”) has been adjusted (the “Adjusted Forecast”) to reflect the issuance of 620,000 Units at a price of $10.00 per Unit for gross proceeds of $6,200 pursuant to the partial exercise of the overallotment option granted by the REIT to the underwriters in the IPO.
7,475 8,308 Adjusted Forecast Actual
Revenue
4,544 5,028 Adjusted Forecast Actual
FFO
3,880 4,301 Adjusted Forecast Actual
AFFO
($thousands) ($thousands) ($thousands, except per unit amounts)
Actual Adjusted Forecast 6,479 5,844 7,235 6,526
NOI & Cash NOI
$0.238 per unit $0.279 per unit
($thousands, except per unit amounts)
$0.252 per unit $0.215 per unit
19
AFFO Payout Ratio
For the three months ended March 31, 20161
Actual Adjusted Forecast Distributions per unit $0.201 $0.201 AFFO per unit $0.238 $0.215 AFFO payout ratio 84.5% 93.5%
(1) Includes the 26 Initial Properties from the IPO, and the properties subsequently acquired (Toyota Woodland, Porsche JLR Edmonton, and Audi Barrie). (2) The REIT’s financial forecast that was included in its IPO prospectus (the “Financial Forecast”) has been adjusted (the “Adjusted Forecast”) to reflect the issuance of 620,000 Units at a price of $10.00 per Unit for gross proceeds of $6,200 pursuant to the partial exercise of the overallotment option granted by the REIT to the underwriters in the IPO.
Q1 2016 CASH DISTRIBUTIONS
$
Total Distributions Declared to Unitholders for Q1 2016
20
RELIABLE LONG-TERM CASH FLOW, WITH CONTRACTED, LONG-TERM RENTAL INCOME GROWTH AND NO LEASE EXPIRATIONS UNTIL 2026
No Lease Maturities for the Next 10 Years
LEASING PROFILE
Group¹
Lease Maturity Schedule
(1) One lease was recently commenced with Go Auto, one of the largest automotive dealership operators in Canada $1.5 $2.2 $1.9 $4.0 $3.7 $4.0 $3.8 $2.9 $1.5 $0.8
6% 8% 7% 15% 14% 15% 14% 11% 6% 3%2.0 3.0 4.0 5.0
'16 '17 '18 '19 '20 '21 '22 '23 '24 '25 '26 '27 '28 '29 '30 '31 '32 '33 '34 '35
10% 15% 20% 25% % of Cash NOI Cash NOI ($million)
21
($thousands, unless otherwise noted) At March 31, 2016 Total assets $407,201 Debt (incl. financing fees) $227,462 Debt to GBV 55.9% Cash and cash equivalents $736 Weighted average effective interest rate on debt 3.16% Weighted average debt term remaining (years) 5.7
BALANCE SHEET
AUTOMOTIVE PROPERTIES REIT – DRIVING UNITHOLDER VALUE
22
Accretive Acquisitions Looking ahead Since IPO
Financial Performance in line with expectations Cumulative $10 million distributed to unitholders Demonstrated execution
acquisition strategy Extensive industry networking has raised the REIT’s profile among dealership owners across Canada Financial Performance consistent with IPO Forecast Cumulative $10 million distributed to unitholders Demonstrated execution
acquisition strategy Extensive industry networking has raised APR’s profile among dealership owners Contractual rent increases from 26 Initial Properties commence in Q3 2016 driving AFFO growth Strategic focus on advancing acquisition program to increase portfolio value and grow cash available for unitholder distributions
Automotive Properties REIT
Annual & Special Meeting
June 8, 2016