Summary of Feasibility study on Mitubiri Landfill CAPACITY BUILDING - - PowerPoint PPT Presentation

summary of feasibility study on mitubiri landfill
SMART_READER_LITE
LIVE PREVIEW

Summary of Feasibility study on Mitubiri Landfill CAPACITY BUILDING - - PowerPoint PPT Presentation

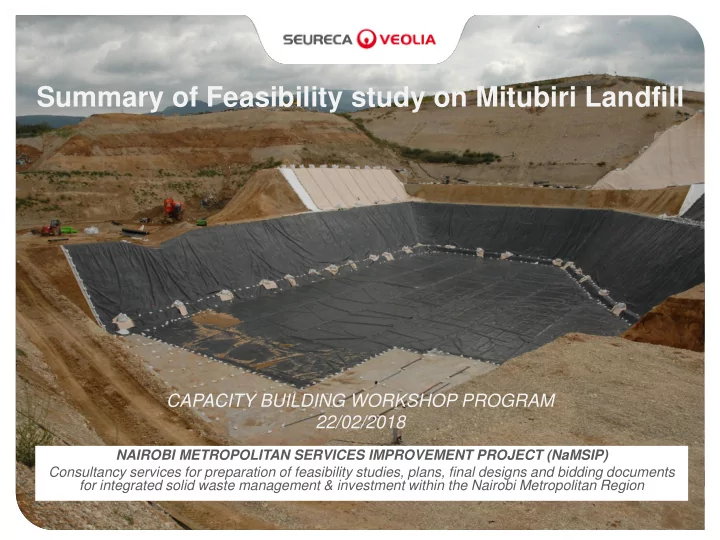
Summary of Feasibility study on Mitubiri Landfill CAPACITY BUILDING WORKSHOP PROGRAM 22/02/2018 NAIROBI METROPOLITAN SERVICES IMPROVEMENT PROJECT (NaMSIP) Consultancy services for preparation of feasibility studies, plans, final designs and


slide-1
SLIDE 1

Summary of Feasibility study on Mitubiri Landfill

NAIROBI METROPOLITAN SERVICES IMPROVEMENT PROJECT (NaMSIP) Consultancy services for preparation of feasibility studies, plans, final designs and bidding documents for integrated solid waste management & investment within the Nairobi Metropolitan Region

CAPACITY BUILDING WORKSHOP PROGRAM 22/02/2018

slide-2
SLIDE 2

Project Objective

Identify the best location for a new landfill in the Nairobi Metropolitan Region (NMR), prepare its detailed design and all the tender documents for its construction and operation.

Project Phase

Project Presentation

2

Landfill Site Identification Feasibility Study Detailed Engineering Design Services Environmental Review

slide-3
SLIDE 3

Waste management context

slide-4
SLIDE 4

Majors issues identified from actual dump sites

ISWM - NMR - 29/04/2015 4

Proximity to urban areas:

most of the sites are now surrounded houses; some are in the middle of the

  • town. This proximity causes two problems. First, the population is directly

exposed to odors, noise, water and air pollution, visual impacts, etc. Second, dumpsites being surrounded by habitations, it leaves no room for extension.

Closeness to surface water:

some of the dumpsites actually in operation are very close to rivers. The leachate from the waste is a direct source of contamination to rivers, under the form of leachate or of waste.

Poor management:

some dumpsites have ‘managers’ (county employees) that can monitor the amount of waste disposed and check that the waste is disposed on the right place; but in most of the sites visited are not controlled whatsoever.

Limits:

some dumpsites are fenced, but in most cases there is no clear boundary between the dumpsite, and the land nearby. This issue leads to site uncontrolled extension: the waste is disposed all around instead of in one designated place increasing land consumption and contamination.

slide-5
SLIDE 5

Modern sanitary landfills need to be developed, to insure a proper waste treatment without environmental impacts

Improving waste treatment

ISWM - NMR - 29/04/2015 5

slide-6
SLIDE 6

Need for incorporate waste treatment in urban planning development plans :

It is an essential service for the population like wastewater treatment

Need to take into account the future growth of the population :

The more people, the more waste : the growth in the waste production needs to be evaluated in order to design proper treatment capacities

Need to take into account the urbanization :

Location of waste treatment facilities must be carefully selected, and take into account the development of the cities

Integration of the waste treatment

ISWM - NMR - 29/04/2015 6

slide-7
SLIDE 7

Landfill Site Selection

slide-8
SLIDE 8

Objectives

Select the most suitable site(s) in terms of technical, economic, environmental and social criteria

Methodology

GIS-based spatial multi-criteria analysis

GIS Model

A widely used tool for landfill site selection Imaging and analysis of spatial data (buffer zones, overlay, etc.)

Criteria selection

Based on World Bank’s guidelines and the Consultant’s experience

Methodology for Site Identification

8

slide-9
SLIDE 9

GIS-based Spatial Multi-Criteria Analysis

9

Phase 1

  • Negative mapping
  • Exclusion of areas that are not suitable for landfill development

e.g., airports, surface water bodies and protected areas…

Phase 2

Positive mapping Evaluation of the suitability of non-excluded areas using criteria which are rated and weighted by

  • rder of importance.

e.g., road accessibility, land use and slope…

Phase 3

  • Identification of potential sites
  • Identification of the best potential sites in collaboration with each county. During this process, land

availability and current land use of the sites will be verified.

Phase 4

  • Evaluation of candidate sites
  • Final review of candidate sites for which counties have confirmed availability using secondary criteria

such as visibility from residential neighbourhoods and availability of borrow material for construction.

slide-10
SLIDE 10

Feasibility study

slide-11
SLIDE 11

11

Site overview

TITRE DE LA PRÉSENTATION / SOUS-TITRE / DATE

slide-12
SLIDE 12

Location

12

The site is located in Murang’a County, in the Maragwa Constituency

slide-13
SLIDE 13

Ownership of the site

The land is a private land located in Mitubiri/Wempa/Block 1/6824 under one title deed and it is one block of 121.3 hectares. Initially, the owner of the site agreed to sell 50 acres for the project. However, considering the development around the site, it has been recommended that a buffer zone should be created between the landfill site and this area. The feasibility recommended that the Murang’a County acquire 50 acres for the landfill + 20 acres for the buffer zone.

Situation of the site during feasibility study :

The area in which the land was found was not subject to any physical development plan The land was covered in eucalyptus vegetation and the surrounding areas were cultivated land. A Land Subdivision Scheme had been issued with a project for housing construction – but it was not approved when the site was selected. The feasibility study recommended that :

A buffer zone was established to create a distance between the site and the future development zone. The county government pushed for the physical planning of the Maragua Sub-county to forestall any unwarranted developments and guide all physical developments (including the definition of buffer zones, proposition for sequential development, restriction in the land use on the landfill site after its closure)

Urban Planning

13

slide-14
SLIDE 14

14

Fields surveys

TITRE DE LA PRÉSENTATION / SOUS-TITRE / DATE

slide-15
SLIDE 15

The topographic survey was finalized on October 7th 2015

Topographical survey

TITRE PRÉSENTATION / SOUS TITRE / DATE 15

slide-16
SLIDE 16

23 tests pits for soil identification

Black cotton soil Red soil Laterites Basaltic tuff

Tests pits

TITRE PRÉSENTATION / SOUS TITRE / DATE 16

Test Pits n°25 : red soil Test Pits n°1 : black cotton soil

slide-17
SLIDE 17

Regarding the particularity of the soil, it was decided to conduct 12 core holes to have a better understanding of the nature of the soil Results were presented in the forms of geological log and geological cross section

Core holes

TITRE PRÉSENTATION / SOUS TITRE / DATE 17

slide-18
SLIDE 18

Geological logs (CS1)

TITRE PRÉSENTATION / SOUS TITRE / DATE 18

Black Coton Soil 0,80m

1 1m

Fracture

1,55m

Fracture

Highly

1,8m

Fracture

weathered tuff

2 2,20m

Fracture

2,5m

2,5m

Fracture

3 3,7m

Fracture

Weathered tuff

4 4,2m

Fracture

5

6m

6

Fresh tuff 6,4m

End of drilling

7

0m CS1

slide-19
SLIDE 19

Location map of geological cross-sections

TITRE PRÉSENTATION / SOUS TITRE / DATE 19

slide-20
SLIDE 20

Geological Section CS1 – CS3

TITRE PRÉSENTATION / SOUS TITRE / DATE 20

slide-21
SLIDE 21

Results confirm that the site may be divided into 3 distinctive parts:

In the Northern half of the site, topsoil is composed of black cotton soil. The underlying rock is composed of weathered tuff at different degrees of alteration with highly decomposed tuff at depths ranging from 3.60 m to 7.10 m. At the base of this formation is the fresh tuff, between 6 and 7 meters except in drilling CS2 where fresh tuff is observed at 3.60 m depth. In CS3 and CS4 no fresh tuff was observed even when bedrock is less weathered (end of drilling at 5,80 m and 6,20 m respectively). In the central part of the site, the topsoil is composed of lateritic soil. The underlying rock is composed of fresh tuff with depths ranging from 4,20 m to 4,90 m. At the base of this formation, weathered tuff is found, with highly weathered tuff in boreholes CS08 and CS09. In the South section of the site, topsoil is composed of lateritic soil South-east and red soil in the South West. The underlying rock is composed of slightly to highly weathered tuff with no fresh tuff except between 2,95 m and 3,80 m depth in borehole CS10.

Findings

TITRE PRÉSENTATION / SOUS TITRE / DATE 21

slide-22
SLIDE 22

Drilling of piezometers

TITRE PRÉSENTATION / SOUS TITRE / DATE 22

Boreholes for test wells were drilled up to a depth of 40 m for PZ1 North East of site, 30m depth for PZ2 South-West of site as well as PZ3, West of site. Formations encountered in deep boreholes are in fully consistent with the results of core drillings Water level is measured at around 12 bgl m in PZ1 and 18m in PZ2, corresponding to a shallow superficial aquifer, overlaying the main rock mass. A second water strike

  • ccurs between 20 to 25 m deep in PZ1 and PZ2. No water strike has been observed

in PZ3 at that depth. The piezometers were equipped to operate as groundwater monitoring wells

slide-23
SLIDE 23

Permeability tests on site Laboratory tests :

Classification Tests on Soils Triaxial Compression Test Shear test Compaction Unconfined Compression Tests on Rock Cores

Others tests

TITRE PRÉSENTATION / SOUS TITRE / DATE 23

slide-24
SLIDE 24

Based on the fields surveys and tests realized during the feasibility study, a conceptual design was proposed for the site.

24

Conceptual design

TITRE DE LA PRÉSENTATION / SOUS-TITRE / DATE

slide-25
SLIDE 25

Preliminary Design 1/2

TITRE PRÉSENTATION / SOUS TITRE / DATE 25

Potential impact Measures implemented in preliminary site design

Odors Some projected developments, specifically on the Western border of the site, will be located downwind from the site and could incur some odors from the site. ➢ A buffer zone of 120 m is created between waste storage cells and housing development. ➢ Landfill gas will be actively extracted from site to minimize release in the atmosphere Visual perception of site At the final stage, the site will rise about 20 m above ground and may generate some visual disruption to the natural landscape. ➢ a 400 m long dike will be raised on the Western border of the site. Dense vegetation will be planted. As a result visual perception will be greatly improved. Noise during

  • peration

➢ As mentioned above, the dike will prevent noise resulting from operation activities to impact residential areas. Furthermore, the main platform where truck traffic is the most important is located opposite to the residential areas. Contamination of surface and underground water ➢ The site will be fully lined with impermeable synthetic membrane in the waste storage cells and all internal roads covered with asphalt. ➢ Leachate from waste cells will be entirely collected and treated. ➢ A sedimentation pond will also retain runoff from site for control, before release in the natural environment.

slide-26
SLIDE 26

Preliminary Design 2/2

TITRE PRÉSENTATION / SOUS TITRE / DATE 26

Potential Impact Measures implemented in preliminary site design

Physical risk of injury due penetration on landfill premises ➢ The site will be entirely fenced and monitored against voluntary or involuntary penetration of people, pets or cattle. Proliferation of birds and pests due to the presence of fresh waste Pests and bird proliferate because of the presence of food waste. ➢ To prevent access to waste, the waste deposit shall be covered daily with inert material (dirt, demolition waste, etc.) Fire The presence of combustible waste along with the production of methane by decomposing organic waste may increase the risk of fire. ➢ a 5000 cubic meter pond of fresh water will be kept available at all times. Note that this reserve may be used for watering, dust abatement and cleaning of site and trucks. ➢ The pond will be replenished continuously from a well drawing spring water from the spring identified during site located right next to it.

slide-27
SLIDE 27

PRELIMINARY DESIGN OF WASTE STORAGE CELLS

TITRE PRÉSENTATION / SOUS TITRE / DATE 27

The design of these cells must comply with the international standards in terms of environmental protection. The main technologies employed in the design included:

state-of-the-art bottom liner systems, modern leachate collection, treatment, landfill gas collection and monitoring, groundwater monitoring, engineered final cover layer.

slide-28
SLIDE 28

Infrastructures and Equipment

TITRE PRÉSENTATION / SOUS TITRE / DATE 28

The feasibility study proposed the following equipment for the site :

Weighbridge + weighbridge software : for monitoring and recording precisely the amount of waste stored in the landfill Mobile equipment to handle the waste : dozer, frontloader, excavator

Leachate management :

Leachate storage in pond Leachate collection Leachate treatment – to be detailed in the final design of the site

Landfill gas capture and use system

13 wells in phase I (cell #1) 27 wells in phase II (Cell #2) Landfill gas treatment by LFG flare Opportunitiy for landfill gas use to be studied

Optional : Material recovering facility

Waste To LFG collection facility Coarse aggregate (R =0,8m) HDPE drain pipe Ø 200 Collection radius R = 30m Well head Sealed cover

slide-29
SLIDE 29

TITRE PRÉSENTATION / SOUS TITRE / DATE 29

slide-30
SLIDE 30

TITRE PRÉSENTATION / SOUS TITRE / DATE 30

slide-31
SLIDE 31

TITRE PRÉSENTATION / SOUS TITRE / DATE 31

slide-32
SLIDE 32

TITRE PRÉSENTATION / SOUS TITRE / DATE 32

slide-33
SLIDE 33

Function Area in square meters Percentage of available land Total available surface 192 600 100% Waste Storage cells 127 000 66% Protection and buffering (for drainage, fencing and vegetation) 38 250 20% Platforms and roads (covered) 20 600 11% Fresh water and sedimentation pond 3 200 2% Leachate storage pond 2 700 1% Technical (pumps, flares, well, etc…) 500 0.3% Buildings 350 0.2%

Land utilization

TITRE PRÉSENTATION / SOUS TITRE / DATE 33

slide-34
SLIDE 34

Cell Footprint (in square meters) Storage volume (in cubic meters) Cell #1 44 500 667 500 Cell #2 82 500 1 485 000 Total 1 + 2 127 000 2 152 500

Site Capacity

TITRE PRÉSENTATION / SOUS TITRE / DATE 34

Site Capacity (at preliminary design stage): This capacity leads to an estimated project life of about :

20 years for a 250 ton daily incoming volume of waste, 10 years for 500 tones and 5 years for 1000 tons.

It was recommended to keep the activity under 500 tons per day to keep impacts under control (mainly traffic) and to preserve the quality

  • f life of the neighboring population.
slide-35
SLIDE 35

Landfill catchment area scenario

TITRE PRÉSENTATION / SOUS TITRE / DATE 35

County landfill :

The site would be dedicated to the Murang’a County Not optimized in term of transportation With this scenario, considering the estimated production of waste in the Murang’a County, the lifetime of the site could be around 13 years.

Regional Landfill site

The site would treat the waste produced nearby Kiambu was implementing a site on its own and would only use Mitubiri site for a small part of its population

County Part of the total population of the County Estimated waste for the Mitubiri landfill between 2018-2028 Repartition between the Counties Murang'a 50% 845 000 44% Kiambu 6% 235 000 12% Machakos 29% 830 000 43% TOTAL 1 910 000

slide-36
SLIDE 36

Landfill catchment area scenario

TITRE PRÉSENTATION / SOUS TITRE / DATE 36

Metropolitan landfill :

It is proposed to include part of the waste from Nairobi County Considering the limited size of the site, it is propose to adjust the quantity from each County as fairly as possible, taken into account the distance to the landfill site.

The scenario proposed in the feasibility study aimed at initiating discussions within the NMR about the potential catchment areas of the landfill

County Part of the total population

  • f the County

Estimated waste for the Mitubiri landfill between 2018-2028 Part of the landfill capacity Murang'a County 50% 845 000 t 44% Kiambu 6% 235 000 t 12% Nairobi 6% 435 000 t 23% Machakos 15% 415 000 t 22%

TOTAL

1 930 000 t

slide-37
SLIDE 37

Annexes

slide-38
SLIDE 38

Geological logs (CS1, CS2 , CS3)

TITRE PRÉSENTATION / SOUS TITRE / DATE 38

Black Coton Soil Black Coton Soil

1,6m

Fracture

Black Coton Soil

1,6m

Fracture

0,80m

1 1m

Fracture

1m

1

1m

1 1,55m

Fracture

Highly

1,8m

Fracture

weathered tuff

2 2 2 2,20m

Fracture

Weathered tuff

2,3m 2,3m

2,5m

2,5m

Fracture

2,5m Fractured zone

Highly

2,5m Fractured zone

weathered tuff

3 3

(decomposed)

3

3,6 m

3,7m

Fracture

3,76m

Fracture

3,76m

Fracture

Weathered tuff

4 4 4 4,2m

Fracture

Fresh tuff

5 5 5m

Fracture

4,90m

5 5m

Fracture

slightly weathered tuff

5,80m

5,80m

5,80m

6m

6 6 5,90m Fractured zone

End of drilling

6 5,90m Fractured zone

Fresh tuff 6,4m 6,5m

End of drilling

End of drilling

7 7 7

0m 0m 0m CS1 CS2 CS3

slide-39
SLIDE 39

Geological logs (CS4, CS5 , CS6)

TITRE PRÉSENTATION / SOUS TITRE / DATE 39

Black Coton Soil Black Coton Soil Black Coton Soil 1m

1

1m

1

0,9m

1

  • Hi. Weathered t.

1,3m 1,3m

Fracture

Decomposed tuff

1,5m 1,6m 1,5m

Highly Highly weathered tuff

2 1,9m

weathered tuff

2

(decomposed)

2 2,2m

Fracture

2,2m

Weathered tuff 2,4m

2,4m

2,7m

3 3

Highly

3

weathered tuff

3,2m

3,4m 3,80m

3,85m

Fracture

4 4 4

Slightly

4,8m

Fracture

Weathered tuff weathered tuff

5 5 5

Slightly weathered tuff

6 6 6 6m

Fracture

6,2m

End of drilling

7

6,9m

7 7

Fresh tuff 7,1m

End of drilling 7,2m

Fresh tuff 7,7m

8 8

End of drilling

8

Fractured zone Fractured zone Fractured zone

0m 0m 0m CS4 CS5 CS6

slide-40
SLIDE 40

Geological logs (CS7, CS8 , CS9)

TITRE PRÉSENTATION / SOUS TITRE / DATE 40

w ater w ater 2/11 2/11

Laterite Laterite Laterire

1 1,10m 1

1,00m

1

1,30m

1,30m

1,5m

1,40mFractured zone 2 2 2 2,40m 2,3m

Fracture

2,10m

Fracture

2,6 m

Fracture

2,40m

Fracture

Fresh tuff

3 2,9m

Fracture

Fresh tuff

3

Fresh tuff

3 3,70m

Fracture

4 4 4

4,2m

4,2m

Fracture

4,4m

Fracture

4,70m

Fracture

5

4,90m

5

4,90m

5

Weathered tuff Weathered tuff Agglomerate tuff

5,8m

Fracture

5,75m decomposed 6,0m

6

Decomposed

6

5,90m

6

End of drilling End of drilling

Weathered

Fractured

Agglomerate tuff

Zone

7 7 7

7,50m

8 8

Reddish brown highly weatered tuff

9

9,70m

9,70m #

CS7 CS8 CS9 0m 0m 0m