
SLIDE 1
Summary of Changes
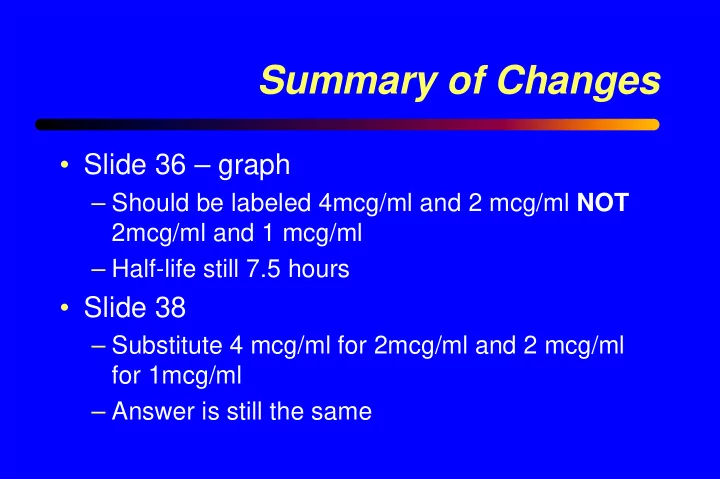
- Slide 36 – graph
– Should be labeled 4mcg/ml and 2 mcg/ml NOT 2mcg/ml and 1 mcg/ml – Half-life still 7.5 hours
- Slide 38
Summary of Changes Slide 36 graph Should be labeled 4mcg/ml and 2 - - PowerPoint PPT Presentation
Summary of Changes Slide 36 graph Should be labeled 4mcg/ml and 2 mcg/ml NOT 2mcg/ml and 1 mcg/ml Half-life still 7.5 hours Slide 38 Substitute 4 mcg/ml for 2mcg/ml and 2 mcg/ml for 1mcg/ml Answer is still the same
GRAPH OF GENTAMICIN PLASMA CONCENTRATION vs.TIME
1.2 2.5 6.2
0.1 1.0 10.0
2 4 6 8 1 1 2 1 4 1 6 1 8 20 22 24
Time Post End of Infusion (hours) Gentamicin Plasma Conc. (mcg/ml)
4 mcg/ml 2 mcg/ml 6h 13.5h