
Financial results for the year ended March 31, 2017 Appendix
INPEX CORPORATION May 15, 2017
1
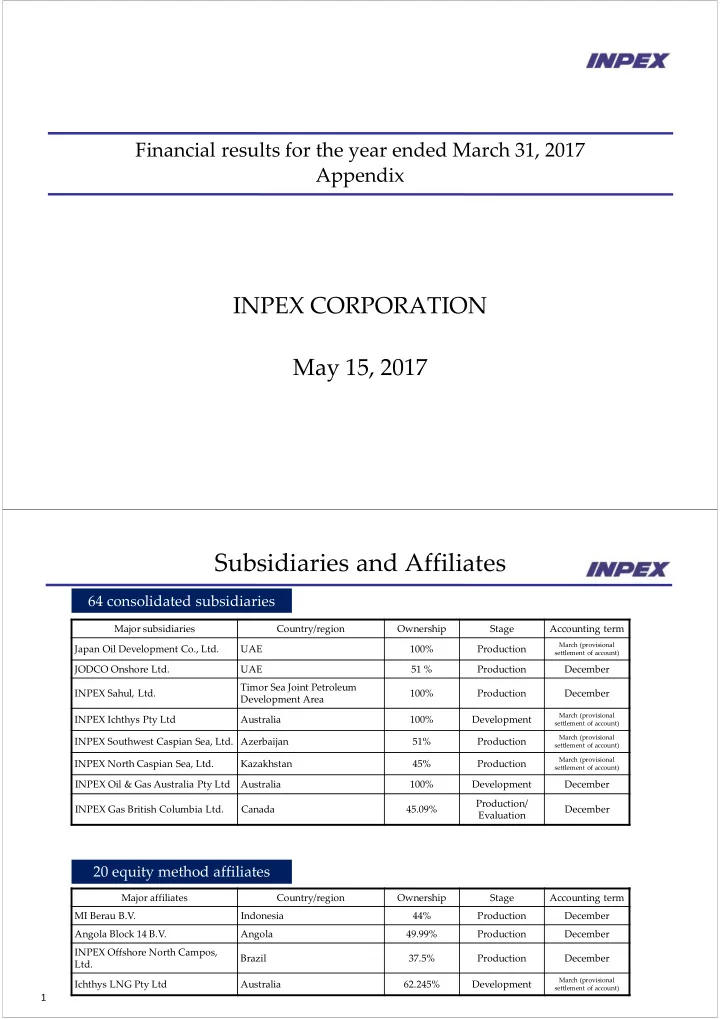
Subsidiaries and Affiliates
64 consolidated subsidiaries 20 equity method affiliates
Major subsidiaries Country/region Ownership Stage Accounting term Japan Oil Development Co., Ltd. UAE 100% Production
March (provisional settlement of account)
JODCO Onshore Ltd. UAE 51 % Production December INPEX Sahul, Ltd. Timor Sea Joint Petroleum Development Area 100% Production December INPEX Ichthys Pty Ltd Australia 100% Development
March (provisional settlement of account)
INPEX Southwest Caspian Sea, Ltd. Azerbaijan 51% Production
March (provisional settlement of account)
INPEX North Caspian Sea, Ltd. Kazakhstan 45% Production
March (provisional settlement of account)
INPEX Oil & Gas Australia Pty Ltd Australia 100% Development December INPEX Gas British Columbia Ltd. Canada 45.09% Production/ Evaluation December Major affiliates Country/region Ownership Stage Accounting term MI Berau B.V. Indonesia 44% Production December Angola Block 14 B.V. Angola 49.99% Production December INPEX Offshore North Campos, Ltd. Brazil 37.5% Production December Ichthys LNG Pty Ltd Australia 62.245% Development
March (provisional settlement of account)