Outlook 2007 March 12, 2007 Mehta Partners and/or its affiliates - - PowerPoint PPT Presentation

outlook 2007
SMART_READER_LITE
LIVE PREVIEW

Outlook 2007 March 12, 2007 Mehta Partners and/or its affiliates - - PowerPoint PPT Presentation

Global Pharmaceutical and Biotechnology Outlook 2007 March 12, 2007 Mehta Partners and/or its affiliates may hold a position in any security or financial instrument mentioned herein. The information contained in this communication is solely


slide-1
SLIDE 1

Mehta Partners and/or its affiliates may hold a position in any security or financial instrument mentioned herein. The information contained in this communication is solely intended for the addressee. Access by anyone other than the addressee is unauthorized. Disclosure or copying or distribution of this information is prohibited.

Global Pharmaceutical and Biotechnology

Outlook 2007

March 12, 2007

slide-2
SLIDE 2

2

MEHTA PARTNERS

BioPharma – Shortening Lifecycles In the Footsteps of the IT Industry?

slide-3
SLIDE 3

3

MEHTA PARTNERS

Global Highlights

  • Is R&D Really About to Turn the Corner?
  • More Me-Too’s, but Also Many True First-in-Class in Larger Crop of New Approvals From 2008
  • Result: Patents a Necessary But Not Sufficient Key for Success
  • Evidence Based Reimbursement vs. Limited Objective Drug Data
  • Despite Declining Pricing Power, Op Margins Likely Steady as R&D and SG&A Ratios Reverse
  • Therapeutic Substitution a Reality; Bio-similars On the Way Around the Turn of the Decade
  • US Share Falling to 40% of World Market, Down From Over 50%
  • Europe Willing to Pay a Fair Price, though Volume Remains Variable
  • Top-10 Markets Mature, Emerging Markets Growing Rapidly (From 10% to 20% to ?)
  • Consolidation—A Love-Hate Exercise Non-Stop
  • Valuation In the Eye of the Beholder
slide-4
SLIDE 4

4

MEHTA PARTNERS

Japanese Pharma – Gradual Improvement

  • Over the past decade, young and worldly savvy managements at a handful of Japanese pharma are

leading the tough task for transforming their global competitive outlook, and beginning to show a pipeline of products with potential worldwide

  • Only these select companies may have the luxury of staying independent, though they are the more

likely and open minded to accelerate their growth via M&A

  • Longer term outlook depends on the nature and magnitude of government reimbursement reforms;

but smaller companies likely to have declining number of options, esp. if Chuikyo finally stops $25 billion “subsidy” on long listed products and enacts rational rules for use of generic drugs

  • Generics: A modest threat for the near-term, but can the “Positive Box”, already being checked on

20% of prescriptions, be made into a “negative box”?

  • Pharmaceuticals accounts for 20-25% of every healthcare Yen spent, but on a relatively modest

GDP base; and this is down from ~40% two decades ago!

  • Further reforms and “right incentives” are essential
  • Interesting pipeline drugs include MRA, CS-747, E-2007, TAK-242, YM-150, SYR-322, TAK-390

MR, TAK-475

slide-5
SLIDE 5

5

MEHTA PARTNERS

But Increasingly Eager to Act Aggressively

  • If spending shifts from long listed products and “me too” focused R&D to true innovation—key for

Japanese pharma to become global competitors—Only a short distance to global success

  • This in turn can free up new drug pricing for true innovations in line with Western prices
  • Eight new drug launches for 2007, but only one has more than $750m peak sales potential. Only two are

in-house drugs

  • Outlook for 2008 notably improves with 17 launches, out of which four have blockbuster potential:

Daiichi-sankyo’s Prasurgel (CS-747), expected peak sales potential of >$ 2.5b; and Takeda’s TAK-242 (sepsis), peak sales $ 1.25-1.5b

  • Sankyo, Chugai, Takeda and Eisai all face 2008 as a crucial year shaping their future as their pipeline at

that stage promises peak sales of ~$13b

  • Any setback will compromise growth around 2010 when key products see their patents expire
  • Takeda and Astellas aggressively licensing in products to expand and support their global infrastructure
slide-6
SLIDE 6

6

MEHTA PARTNERS

Is R&D Really About to Turn the Corner?

slide-7
SLIDE 7

7

MEHTA PARTNERS

A Sustainable Inflection Point?

47 40 59 72 66 17 15 34 42 40 8 11 12 15 18 20 40 60 80 100 120 140 2006 2007 2008 2009 2010

  • No. Of Drugs

Peak Sales <$500m Peak Sales $500-$1000m Peak Sales >$1000m

slide-8
SLIDE 8

8

MEHTA PARTNERS

More Me-too’s (M) AND More First in Class (N)

Source: Mehta Partners, Company Reports

27 14 28 49 41 14 19 23 30 22 3 17 25 32 33 15 17 26 19 25 20 40 60 80 100 120 140 2006 2007 2008 2009 2010

Year

  • No. of Drugs

M2=Me too, small Impact M1=Me too, relatively large impact N2=NCE but following first n class N1=New Mechanism, First in Class, New Science

slide-9
SLIDE 9

9

MEHTA PARTNERS

Expected Drug Launches 2007 - 2011

Wither Mature Biotechs and Specialty Pharma?

Launch Tally by Sector* 2007 2008 2009 2010 2011 Peak Sales <$500m 42 73 86 73 64 % of Total 64% 70% 67% 59% 63% Rising Stars 11 24 41 34 16 Mature Biotechs 4 7 6 7 8 Specialty Pharma 9 9 8 6 9 Global Pharma US & EU 12 24 23 15 13 Japan 6 9 8 11 18 Peak Sales $500-$1000m 20 40 53 51 36 % of Total 30% 38% 40% 41% 35% Rising Stars 4 7 14 14 7 Mature Biotechs 1 2 6 5 2 Specialty Pharma 2 3 8 9 1 Global Pharma US & EU 12 24 20 21 18 Japan 1 4 5 4 8 Peak Sales >$1000m 15 15 20 25 20 % of Total 23% 14% 15% 20% 20% Rising Stars 2 2 5 8 6 Mature Biotechs 2 1 2 Specialty Pharma 1 1 2 Global Pharma US & EU 9 7 10 9 10 Japan 1 4 5 4 4 *Partnered drugs may be counted in multiple sectors Source: Mehta Partners, Company Reports

slide-10
SLIDE 10

10

MEHTA PARTNERS

Sustainable? Will Become Clear by 2009

  • 15 and 21 launches in 2008 and 2009 respectively, each with peak sales of > $1b vs. eight and 11 in 2006

and 2007. Improvement certainly, but many of these are high risk

  • Mature Biotech facing same issues as Global Pharma—thin pipelines
  • Specialty Pharma even worse—thin pipeline + no potential blockbusters until 2008
  • 2007 Ranking of Expected Launches
  • NOVN (>$4.0b for $29b of Total Pharmaceutical sales)
  • WYE (>$3b for $19b of Total Pharmaceutical sales)
  • GSK (>$2b for $38b of Total Pharmaceutical sales)
  • SAN (>$2b for $38b of Total Pharmaceutical sales)
slide-11
SLIDE 11

11

MEHTA PARTNERS

Selected Companies in Strong Position

  • Novartis with Tekturna, Exforge and Galvus (combined peak sales potential of $4b) , Wyeth with

Pristiq, Bifeprunox and Bazedoxifene (combined peak sales potential of $3b) and GSK with Allermist, Cervarix and Tykerb (combined peak sales potential of $2b) to shine in 2007.

  • Other major launches
  • SAN’s Acomplia in US in MY07 (?)
  • LLY/Sankyo’s Prasugrel in ’08
  • LLY/AMLN/ALK’s Byetta LAR in 09
  • Roche’s CERA in 07(?), Roche/Chugai Actemra/MRA in “08
  • SGP’s HCV PI in 2010
  • UCB’s Cimzia for Crohn’s in early 07
  • 2008 will be crucial for Japan Pharma, as several launches are expected, Daiichi Sankyo (CS -747),

Takeda (TAK-242), Eisai (E-2007, E-7389) , Shionogi (doripenam/S-4661), Kyowa Hakko (KW-6002) and Astellas (Regadenoson, Telavancin and RSD-1235)

slide-12
SLIDE 12

12

MEHTA PARTNERS

Patents Necessary, But No Longer Sufficient

slide-13
SLIDE 13

13

MEHTA PARTNERS

Electronics Industry Mold the Future?

  • Medicare Part D give MCO and PBM much broader role to achieve savings, beyond simple generic

substitution

  • In this age of information overflow, managers can’t hide behind the veil of regulatory barriers, so the

industry model will change rapidly as has the electronics industry – reshaped by free market, with ever shortening life cycle of break-through innovations

  • Competition intensifying everywhere, from statins to MS to RA
  • Vectibix of Amgen, only a second drug in its category after Erbitux, with a significantly improved

market platform is priced at a 20-30% discount to Erbitux—would have fetched a 30% premium as recently as three years ago

153 217 31.5 50.9 9.1 2 36.7 19.12 19.02 11.43 11.36 10.8 0.00 50.00 100.00 150.00 200.00 250.00 4Q 05 A 5/20/2005 Q1 06A 5/23/2005 Q2 06A 5/25/2005 Q3 06A 5/26/2005 Q4 06A 5/27/2005

Q u a r t e r l y S a l e s

5 10 15 20 25

S h a r e P r i c e

Lucentis Macugen E yetech Share price

Lucentis Launch Lucentis Data Released

slide-14
SLIDE 14

14

MEHTA PARTNERS

Competition Intensifying across Therapy Area’s: Oncology

ONCOLOGY PIPELINE : 155 Mechanism of Action, 474 Compounds The Other 49% of Molecules Still Focused On the 90% of Mechanisms…

MOA Molecule DNA antagonist Teniposide, nimustine Immunostimulant TheraCys, melanoma vaccine DNA topoisomerase ATP hydrolysing inhibitor Mitoxantrone, amrubicin hydrochloride DNA topoisomerase inhibitor Topotecan, rubitecan Apoptosis agonist Homoharringtonine, Urocidin DNA synthesis inhibitor Clofarabine, nelarabine Tubulin antagonist Vinorelbine, E-7389 Endothelial growth factor receptor-2 kinase inhibitor Pazopanib hydrochloride, Vatalanib Microtubule stimulant Docetaxel, ixabepilone Radical formation agonist Temoporfin, Porfimer sodium Estrogen antagonist Toremifene citrate, Tamoxifen Histone deacetylase inhibitor Vorinostat, Romidespin RNA synthesis inhibitor Zorubicin, Bisantrene Thymidylate synthase inhibitor Carmofur, Doxifluridine ErbB-1 inhibitor Gefitinib, Erlotinib

10 51 90 49

Mechanism of Action % NCE’s %

slide-15
SLIDE 15

15

MEHTA PARTNERS

Evidence Based Reimbursement vs. Limited Objective Drug Data

slide-16
SLIDE 16

16

MEHTA PARTNERS

Selling + Life Cycle Management Under Challenge

  • Marketing, not selling, will be the primary success requirement for useful new drugs
  • NICE has begun to sponsor “counter-studies”, CMS is encouraging evidence based reimbursement

(EBR), Koseisho can’t be too far

  • None have the budget to conduct objective clinical studies to help define ways for optimal use of

important therapeutics

  • Need of the hour is such objective risk:reward assessment of new drugs, but who will pay?
  • Industry may be asked to contribute a portion of its budget for an independent consortium
  • Perhaps painful in the short term by reducing inappropriate use of lesser drugs, but longer term this

should spur full adoption of truly cost effective innovations

  • Incremental innovation increasingly at risk: Celexa/Lexapro; Nexium/PriLosec…
slide-17
SLIDE 17

17

MEHTA PARTNERS

What Does it Take to be Truly Innovation Driven?

slide-18
SLIDE 18

18

MEHTA PARTNERS

Not By Spending Twice as Much on S&M as on R&D

BUT Top and Bottom Line Do Not Return to Sustainable Double Digit Growth Improving Operating Margins to 36%

Pharma Company of Today?

2006 2007 2008 2009 2010 2011 2012 2013 2014 2015 2016 Sales 10.0 10.7 11.4 12.3 13.1 14.0 15.0 16.1 17.2 18.4 19.7 %Change 7.0 7.0 7.0 7.0 7.0 7.0 7.0 7.0 7.0 7.0 COGS 2.0 2.1 2.3 2.5 2.6 2.8 3.0 3.2 3.4 3.7 3.9 COGS % of Sales

20.0 20.0 20.0 20.0 20.0 20.0 20.0 20.0 20.0 20.0 20.0

% change

7.0 7.0 7.0 7.0 7.0 7.0 7.0 7.0 7.0 7.0

SG&A 3.4 3.5 3.6 3.7 3.8 3.9 4.1 4.2 4.3 4.4 4.6 SG&A % of Sales

34.0 32.7 31.5 30.3 29.2 28.1 27.1 26.0 25.1 24.1 23.2

% change

0.0 3.0 3.0 3.0 3.0 3.0 3.0 3.0 3.0 3.0 3.0

R&D % of Sales 1.6 1.8 1.9 2.1 2.3 2.6 2.8 3.1 3.4 3.8 4.1 R&D % of Sales

16.0 16.4 16.9 17.4 17.9 18.4 18.9 19.4 20.0 20.5 21.1

% change

0.0 10.0 10.0 10.0 10.0 10.0 10.0 10.0 10.0 10.0 10.0

Op Profit 3.0 3.3 3.6 4.0 4.3 4.7 5.1 5.5 6.0 6.5 7.0

  • Op. Margin

30.0 30.8 31.6 32.3 32.9 33.5 34.1 34.5 35.0 35.3 35.7

% Change

0.0 9.9 9.6 9.4 9.1 8.9 8.7 8.5 8.3 8.2 8.0

slide-19
SLIDE 19

19

MEHTA PARTNERS

A Bolder Paradigm to Return to Higher Growth

A Sustainable Double Digit Growth and a Modestly Improved Operating Margin

Hypothetical Pharma Company of Tomorrow

2006 2007 2008 2009 2010 2011 2012 2013 2014 2015 2016 Sales 10.0 10.7 11.4 12.3 13.2 14.4 15.6 17.1 18.8 20.7 22.8 %Change

6.5 7.0 7.5 8.0 8.5 9.0 9.5 10.0 10.0 10.0

COGS

2.0 2.1 2.3 2.5 2.6 2.9 3.1 3.4 3.8 4.1 4.6

COGS % of Sales

20.0 20.0 20.0 20.0 20.0 20.0 20.0 20.0 20.0 20.0 20.0

% change

0.0 6.5 7.0 7.5 8.0 8.5 9.0 9.5 10.0 10.0 10.0

SG&A

3.4 3.5 3.5 3.6 3.7 3.9 4.0 4.1 4.3 4.4 4.6

SG&A % of Sales

34.0 32.6 31.1 29.7 28.3 26.8 25.4 24.0 22.6 21.3 20.0

% change

0.0 2.0 2.3 2.5 2.8 3.0 3.3 3.5 3.5 3.5 3.5

R&D % of Sales

1.6 1.8 2.1 2.4 2.8 3.2 3.7 4.3 4.9 5.6 6.5

R&D % of Sales

16.0 17.3 18.6 19.9 21.2 22.4 23.7 24.8 26.0 27.2 28.4

% change

0.0 15.0 15.0 15.0 15.0 15.0 15.0 15.0 15.0 15.0 15.0

Op Profit

3.0 3.2 3.5 3.7 4.0 4.4 4.8 5.3 5.9 6.5 7.2

  • Op. Margin

30.0 30.2 30.3 30.5 30.6 30.8 30.9 31.1 31.4 31.6 31.6

% Change 0.0 7.1 7.5 8.0 8.5 9.1 9.6 10.2 11.0 10.5 10.1

slide-20
SLIDE 20

20

MEHTA PARTNERS

Generics Growing Therapeutic Substitution a Reality Biosimilars (FOB) on the Horizon

slide-21
SLIDE 21

21

MEHTA PARTNERS

Generics Growing and Therapeutic Substitution

  • 50% of the 06 WW pharma sales will face generic competition during 2007-12
  • Democratic control of the US Congress
  • Brings brand name pharma’s successful tactics (patent settlement with generic companies, authorized

generics, etc.,) under more intense scrutiny

  • Life Cycle Management Strategy increasingly challenged by MCO’s
  • Japan, France and other smaller but more profitable markets increasingly accepting generics, opening up new

challenges for brand name companies and major opportunities for generic companies

slide-22
SLIDE 22

22

MEHTA PARTNERS

European Global Pharma Less Exposed

Eight of the Top-10 New Drugs Were From the US Global Pharma in the Last Round

slide-23
SLIDE 23

23

MEHTA PARTNERS

Biosimilars (FOB) to Take Longer But Be More Painful

  • The first wave of Biosimilars (FOB) before 2010 is unlikely even in Europe, and it won’t be until 2013

that some of the major biologics go generic in the US

  • Epogen, Neupogen and Interferons copies under development at many generic companies
  • The next batch of molecules, including monoclonal antibodies, unlikely to be far behind
  • Unlike the first batch, most biologics unlikely to have “perpetual monopoly”
  • If existing capacities are any indication, a 50% discounting can not be ruled out even for the initial batch
  • f Biosimilars (FOB)
  • Increasing acceptance of reference pricing will compound the problem
  • Biologics deemed to be more difficult to make, or believed not to be on many radars also a part of active

effort at many companies worldwide

  • Few opportunities undiscovered

Many Pressure Points Converging on the US Market

slide-24
SLIDE 24

24

MEHTA PARTNERS

US Share of the World Pharma Market Falling, As EU is Willing to Pay Higher Prices…

slide-25
SLIDE 25

25

MEHTA PARTNERS

And Emerging Markets Growing Rapidly

  • Both China and India are fast becoming mainstream markets
  • Projected to rank 3rd and 5th worldwide within a decade
  • Take the example of Indian domestic growth:
  • 8%+ GDP growth resulting in increased healthcare penetration (up to $82 per capita in 2003 from

$69 in 1999)

  • Rural Market which Constitutes 20% of total market growing by 30+%
  • Health insurance low at 0.9% of private expenditure in 2003, but entry of private players stimulating

growth

  • Patent protection unfolding well, MNCs gaining confidence, contract research opportunities estimated

at $630m currently to grow to $2b+ in 2010

  • Most MNC innovators have bold plans for India—but over time and cautiously
slide-26
SLIDE 26

26

MEHTA PARTNERS

Indian Pharma Companies in Top-50

Gain Rank Rank Rank Rank > 3 2006 2011 2006 2011

Celgene 14 48 34 King

  • 10

36 46 Cipla 10 51 41 Eisai*

  • 5

22 27 Merck KG 8 24 16 DainipponSumitomo

  • 5

34 39 Ranbaxy 8 41 33 Kissei

  • 5

54 59 Aurobindo 7 56 49 Astellas

  • 4

18 22 Sepracor 6 46 40 Kyowa Hakko

  • 4

27 31 Sun Pharma 6 57 51 Pfizer

  • 3

1 4 Gilead 5 29 24 Santen

  • 3

49 52 Shire 5 37 32 Glenmark 5 63 58 United Therap. 5 67 62 Genentech 4 17 13

  • H. Lundbeck

4 39 35 Medimmune 4 42 38 Lupin 4 58 54 Wockhardt 4 60 56 Unichem 4 69 65 Dishman 4 70 66 Roche 3 6 3 Allergan 3 28 25 Chugai 3 32 29 Biogen-Idec 3 33 30

MAJOR MOVERS IN MARKET SHARE RANK ('06 -'11)

Company Company Drop > 3

slide-27
SLIDE 27

27

MEHTA PARTNERS

Consolidation—A Love-Hate Exercise Non-Stop

slide-28
SLIDE 28

28

MEHTA PARTNERS

Consolidation - Fall 2006 a Turning Point?

7 5 4 9 24 17 16 16 28 31 34 21 42 24 45 60 61 10 20 30 40 50 60 70 1990 1991 1992 1993 1994 1995 1996 1997 1998 1999 2000 2001 2002 2003 2004 2005 2006 Number of Deals 20 40 60 80 100 120 140 160 180 200 Deal Value ($ b)

Deal Value ($ B) (LHS) Number of Deals (RHS) Source: Mehta Partners, Company Reports

In 2006, a record 61 deals have been signed, 21 just in Oct and Nov alone, as much as in all of 2001!

slide-29
SLIDE 29

29

MEHTA PARTNERS

Consolidation Drivers – Global US

Key Non-Financial Criteria MRK JNJ ABT LLY WYE BMY SGP PFE Valuation of Equity 3 3 3 3 3 3 5 2 Management 3 5 2 4 3 1 4 2 Discovery Capability 4 2 1 4 2 2 2 2 In-Licensing Ability 4 5 3 4 3 3 2 4 Early Stage Pipeline 4 1 2 4 3 3 2 4 Late Stage Pipeline 3 3 2 3 4 4 3 2 Clinical Develop. Ability 5 2 2 3 4 3 3 4 Marketing Team 4 4 3 3 4 3 3 4 US Market Strength 5 4 2 4 3 3 3 5 Int'l Market Strength 4 4 2 3 2 2 3 5 Existing/Growing Rev. Source 4 2 3 1 3 3 4 1 Recommended Action Multistep, New Science Acquisition 2 1 2 3 3 4 2 3 Merge w/ an Equal 3 3 2 2 1 2 2 3 Sell Out 3 5 2 4 1 3 3 5 Note: 1=Low, 5=High Source: Mehta Partners, Company Reports

Skill Gaps Often Trigger M&A

slide-30
SLIDE 30

30

MEHTA PARTNERS

Consolidation Drivers – Global EU

Key Non-Financial Criteria NOVN GSK SAN ROG NOVOB AZN Valuation of Equity 4 2 2 5 4 4 Management 4 3 3 5 4 3 Discovery Capability 2 4 3 1 3 2 In-Licensing Ability 5 5 3 2 2 3 Early Stage Pipeline 4 5 4 3 1 2 Late Stage Pipeline 3 3 3 4 2 2 Clinical Develop. Ability 4 3 3 5 2 1 US Market Strength 4 4 3 1 4 4 Int'l Market Strength 4 5 4 5 5 4 Existing/Growing Rev. Source 5 3 3 5 4 4 Recommended Action Multistep, New Science Acquisition 2 2 2 3 4 2 Merge w/ an Equal 4 2 4 4 4 1 Sell Out 5 4 5 5 4 3

Note: 1=Low, 5=High Source: Mehta Partners, Company Reports

slide-31
SLIDE 31

31

MEHTA PARTNERS

Consolidation Drivers – Specialty Pharma

Key Non-Financial Criteria SEPR UCB/SRZ UTHR AGN CEPH FRX LUN MRK.GR/SEO SHP.LN VRX KG Valuation of Equity 3 4 3 5 4 3 2 3 5 2 2 Management 4 4 4 5 3 3 3 3 4 3 2 Discovery Capability 2 4 2 3 2 1 3 3 2 1 1 In-Licensing Ability 3 4 2 3 5 4 4 4 3 3 2 Early Stage Pipeline 3 3 3 2 2 2 3 3 2 1 1 Late Stage Pipeline 1 5 3 4 4 2 2 3 5 2 3 Clinical Develop. Ability 5 3 3 4 4 2 3 2 3 3 2 US Market Strength 4 2 3 5 4 4 1 3 4 3 3 Int'l Market Strength 1 3 3 3 2 1 3 3 2 2 1 Existing/Growing Rev. Source 5 3 4 4 3 3 3 3 2 3 1 Recommended Action Multistep, New Science Acquisition 3 4 3 5 4 3 2 3 2 2 Merge w/ an Equal 4 4 4 5 3 3 3 5 4 Sell Out 2 4 2 3 2 1 3 4 3 5

Note: 1=Low, 5=High Source: Mehta Partners, Company Reports

slide-32
SLIDE 32

32

MEHTA PARTNERS

Partners Often Make Obvious Targets

Sr.No. Company Key Drug Indication Buyer Comments

1 NPS pharma Amylin Trimeris Progenics InterMune Cardiome pharma CV therapeutics Atherogenics PREOS Osteoporosis Amgen With high long term debt, burn rate as well 2 LAR Diabetes Lilly Long term benefits for lilly 3 Fuzeon HIV Roche 4 Methylnaltreone chronic opioid-IBD Wyeth Proof-of-concept PhII study of oral MNTX 5 ITMN-191 HCV Roche Potent HCV protease inhibitor; to be bought after demonstrating human POC study data of ITMN-191 6 RSD1235 atrial fibrillation Astellas With +ve data from PhIIa study for an oral formualtion 7 Ranexa angina Astellas/GSK High burn rate of $250m a yr; MERLIN study data (-ve expectation/on high risk) 8 AGI-1067 atherosclerosis AstraZeneca High burn rate (of $130m); if ARISE fails thn only 1 compd in pipeline w/ large net dept

Source: Mehta Partners, Company Reports

slide-33
SLIDE 33

33

MEHTA PARTNERS

Consolidation Drivers : Where Are Therapeutic Gaps?

THERAPEUTIC CLASS MATRIX -- GLOBAL

Company Price 11/30/06 (Local Cur.) Mkt Cap 11/30/06 (USD) 2006 Pharma Sales (USD) Auto-Imm/Inflam Cancer Hematology C V/ Circulatory Lipid Disorders CNS Dermatology Gastroenter-

  • logy

Genetic Disorders Infectious Disease Metabolic Endocrine Opthalm-ology Respiratory Sexual Dysfunction Supportive Treatment Wound Healing Other Ticker US Global Therapeutic Class Sales as a Percentage of Company Pharma Sales Abbott 47.96 74,578 12,744 16 2 11 17 22 7 25 ABT Bayer 39.16 37,004 5,856 5 11 22 62 BAY Bristol-Myers 25.35 50,294 15,024 11 44 10 21 15 BMY Johnson&John son 65.95 191,486 24,601 13 13 30 5 6 4 29 JNJ Lilly 54.00 61,073 15,531 14 3 44 4 35 LLY Merck 43.93 96,031 22,110 17 20 14 14 4 16 16 MRK Pfizer 25.17 184,877 44,887 5 43 13 8 8 22 PFE Schering- Plough 22.71 33,497 9,535 9 4 16 2 30 18 22 SGP Wyeth 50.41 66,435 19,098 18 4 21 11 11 35 WYE

slide-34
SLIDE 34

34

MEHTA PARTNERS

Valuation is in the Eye of the Beholder

slide-35
SLIDE 35

35

MEHTA PARTNERS

BioPharma WW Market Value 1.8 9.0 4.9 4.2 4.2 9.0 10.1 13.8 12.5 3.1 2.7 3.0 11.0 10.5 10.3 89.9 79.0 74.0 68.4 70.3 3.6 4.8 0% 10% 20% 30% 40% 50% 60% 70% 80% 90% 100% '98 '01 '04 '05 '06 Global Pharma Specialty Pharma Generics Mature Biotech Rising Stars

Mature Biotechs Face the Fate of Global Pharma

Pipeline Woes at Mature Biotech and Specialty Pharma

slide-36
SLIDE 36

36

MEHTA PARTNERS

Global Pharma—Sustainable Market Value Recovery?

Will Sales and Cash Flow Erosion Recover Behind Improving Pipeline?

89.9 79.0 74.0 68.4 70.3 87.5 90.0 84.7 85.8 84.3 86.6 89.2 89.0 90.2 85.5 65.0 75.0 85.0 95.0 1998 2001 2004 2005 2006 % Share Market Value WW Sales Cash Flow

slide-37
SLIDE 37

37

MEHTA PARTNERS

How the BioPharma Universe has shaped up?

Category '98 '01 '04 '05 '06 '98 '01 '04 '05 '06 '98 '01 '04 '05 '06 Rising Stars

1.8 9.0 4.9 4.2 4.2 0.4 1.0 0.6 0.0 0.0 0.0 0.0

Mature Biotech

3.6 9.0 10.1 13.8 12.5 3.3 4.0 4.9 5.7 6.5 4.4 4.0 5.1 5.9 8.7

Generics

3.1 2.7 1.9 2.4 1.3 1.4

Specialty Pharma

4.8 3.0 11.0 10.5 10.3 8.8 6.0 9.8 6.6 6.8 5.4 5.0 8.3 3.6 4.4

Global Pharma

89.9 79.0 74.0 68.4 70.3 87.5 90.0 84.7 85.8 84.3 90.2 89.0 86.6 89.2 85.5

Market Value (%) WW Sales (%) Cash Flow (%)

slide-38
SLIDE 38

38

MEHTA PARTNERS

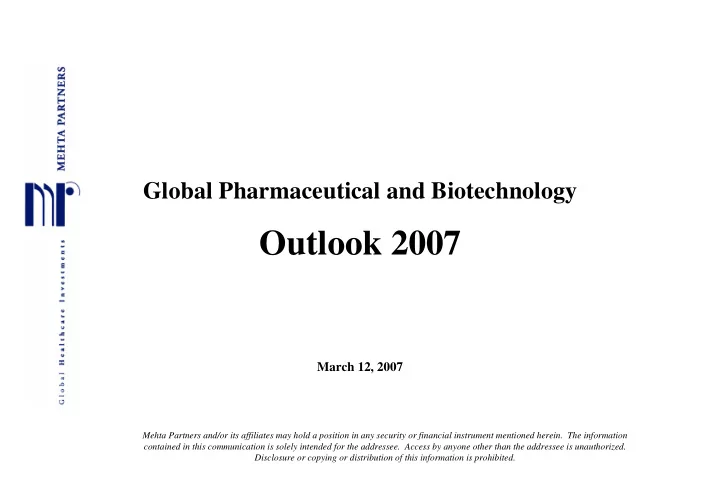
What Role Will the Rising Stars Play?

Continued…

Source: Mehta Partners, Company Reports

Note: BOLD = Significant upside remaining * = Binary event ( ) = Acquired

1986-1996 1997-2000 2001 2002 2003 2004 2005

Genentech (Biomatrix) Collagenex Affymetrix Actelion Acambis (Connetics)

Periostat DNA Chips Tracleer Vaccines Olux

Amgen Cangene (Cor Therap) Cephalon Celgene (Atrix) (Guilford) Genzyme Enzo

Integrilin Provigil, Actiq Thalidomid Eligard Aquavan

Chiron (Biogen) Enzon Endo Pharma Imclone (Ilex Oncology)

PegIntron AN 3218, DepoMorphine Erbitux Campath, CLA

(Biochem) (Genecor) QLT Inc. Gilead Medicines Co. Morphosys (Medco) (Idec)

Visudyne Viread, Hepsera Angiomax Antibodies

Applera Invitrogen (Kos Pharm) Salix Pharmion

Niaspan, Advicor Colazal Vidaza, Thalomid

Qiagen Medimmune Martek United Therap Skyepharma (Immunex)

DHA/ARA oils Remodulin Paxil CR

Noven (Powderject) Sepracor

Fluvirin, Dukoral Xopenex, Lunesta

Zeltia (Sangstat) Viropharma Cerep

Thymo, RDP-58 Vancocin (Rhein)

Valeant Pharmaceutical

Ribavirin

8 13 4 9 2 6 9

slide-39
SLIDE 39

39

MEHTA PARTNERS

Sweet Spot on the Eve of Sustainable Profitability

Note: BOLD = Significant upside remaining * = Binary event ( ) = Acquired

Source: Mehta Partners, Company Reports

2006 2007 2008 2009 2010

(Berna) Alkermes Aeterna Advanced Life Sciences Adolor*

TravellersVax, MMR Risperdal Consta Perifosine, Atrium Cethromycin Entereg

Cubist BioMarin Amylin Adventrx* Advancis

Cubicin Aldurazyme Symlin,Exanatide CoFactor Amoxicillin PULSYS

(Eyetech) OSI (Anormed) Alexion* Allos*

Macugen Tarceva Mozobil Exulizumab Efaproxyn

(Icos) Pozen* Atherogenics * Basilea Ariad

Cialis Trexima AGI-1067 Ceftobiprole AP23573

(ID Biomedical) (Transkaryotic) Bioenvision Coley Array Biopharma

Fluinsure Replagal, I2S Clofarabine Promune ARRY-142-886

(Ligand) (Vicuron) Caliper Conjuchem* Cell Genesys

Avinza , Ontak Anidulafungin DAC-GLP-1 LabChip GVAX

Millennium CV Therap.*

Integrilin, Velcade

Cardiome

Ranexa

Corgentech*

ALGRX-3268, NF-kB Deco

Protein Design

RSD1235

Cypress Bio.*

Royalties milnacipran

Curagen Crucell

PXD101, GS53135

GeneLogic

Vaccines GeneExpress

Curis 8 7 20 27 37

slide-40
SLIDE 40

40

MEHTA PARTNERS

However, There will be Many Blow Ups

Cumulative Number of Companies Turning Profitable

59 66 86 113 61 77 105 131 2006 2007 2008 2009

Oultook 07 ( Est) Outlook 06 (Est)

slide-41
SLIDE 41

41

MEHTA PARTNERS

Valuation Methodology

slide-42
SLIDE 42

42

MEHTA PARTNERS

MarValOuS™ Methodology

slide-43
SLIDE 43

43

MEHTA PARTNERS

BioPharma Industry Poised

  • New generation of managers are more willing to face up to the major challenges
  • SG&A constraints and R&D investment trends point to R&D to Sales ratio rising to over 25%, while

SG&A to sales ratio falling towards 20% over the next decade, with stable margins

  • R&D may turn the corner if the early signals of strong new product flow are confirmed
  • M&A and consolidation to continue with increasing focus on pipeline.
  • Combination therapies to be another growth drivers
  • Medicare Part D drug plan one-time boost, as near term costs are better controlled by private sector
  • Biosimilars (FOB) not likely until the turn of the decade, first in EU followed by the US in 2012/13 - a

badly needed reprieve to mature biotechs

  • EU paying a fair price for biologicals
  • Emerging Markets are growth engines, with more countries joining
slide-44
SLIDE 44

44

MEHTA PARTNERS

But…

slide-45
SLIDE 45

45

MEHTA PARTNERS

Challenges Persist

  • Post Zocor- Pravachol US Patent expiry, therapeutic substitution is getting more intense as 6-month

exclusivity ended Dec 23rd, 2006

  • Discounts of 99%!
  • Impact on gross margins
  • German reference pricing, UK “NICE”, and Japanese health reforms intensifying cost containment

efforts, but often perpetuating irrational and counter-productive cost-containment rules

  • Is Japan more like Portugal, with generic value share being higher than volume share?
  • CMS unlikely to negotiate drug prices, but more focused on value
  • After 2008 US elections, CMS priorities will likely shift as Part D drug benefit program costs jump
  • Evidence Based Reimbursement (EBR) increasingly important, not only for CMS but in Europe and

around the world—a dilemma for the industry to accept comparative studies vs. active drugs

  • Off-label reimbursement in the US already declining
  • With CMS demanding competitive data, selling skills to become less important
slide-46
SLIDE 46

46

MEHTA PARTNERS

  • Competition will continue to intensify—as lower peak sales are reached sooner
  • Generic volumes to continue to grow at innovators expense (Part D share of generics at

63%!), but few generic companies benefit despite rapid consolidation among generic companies as price erosions reach 99% level—correction, 99.4%

  • Indian companies claim to make a nice profit even at these prices
  • And the Chinese companies have not even begun to play with full force
  • Biogenerics (FOB) vs. poor pipelines of mature biotechs
  • Discounting within a decade likely not much lower than small molecules
  • Valuation of Mature Biotech cos already pressured, defensive M&A inevitable
  • Will mature biotechs over the next decade repeat the errors of the large pharma over the

past decade?

  • US share of the WW Pharma sales declining from over 50% towards 40%
  • WW Sales growth forecast cut from 7.5% in 2006 to 6.5% this year—10% seems very far
  • OTC switch should be revived as the de-facto “behind the counter” US system now qualifies

statins for OTC and many more should follow.

And

slide-47
SLIDE 47

47

MEHTA PARTNERS

Performance of Indian Indices relative to International Benchmarks

RHS - BSE Sensex; all indices re-based to 100 at beginning values

200 400 600 800 1000 1200 1400 1600 1800 1 2 / 3 / 1 9 6 6 1 2 / 2 9 / 1 9 6 7 1 2 / 3 1 / 1 9 6 8 1 2 / 3 1 / 1 9 6 9 1 2 / 3 1 / 1 9 7 1 2 / 3 1 / 1 9 7 1 1 2 / 2 9 / 1 9 7 2 1 2 / 3 1 / 1 9 7 3 1 2 / 3 1 / 1 9 7 4 1 2 / 3 1 / 1 9 7 5 1 2 / 3 1 / 1 9 7 6 1 2 / 3 / 1 9 7 7 1 2 / 2 9 / 1 9 7 8 1 2 / 3 1 / 1 9 7 9 1 2 / 3 1 / 1 9 8 1 2 / 3 1 / 1 9 8 1 1 2 / 3 1 / 1 9 8 2 1 2 / 3 / 1 9 8 3 1 2 / 3 1 / 1 9 8 4 1 2 / 3 1 / 1 9 8 5 1 2 / 3 1 / 1 9 8 6 1 2 / 3 1 / 1 9 8 7 1 2 / 3 / 1 9 8 8 1 2 / 2 9 / 1 9 8 9 1 2 / 3 1 / 1 9 9 1 2 / 3 1 / 1 9 9 1 1 2 / 3 1 / 1 9 9 2 1 2 / 3 1 / 1 9 9 3 1 2 / 3 / 1 9 9 4 1 2 / 2 9 / 1 9 9 5 1 2 / 3 1 / 1 9 9 6 1 2 / 3 1 / 1 9 9 7 1 2 / 3 1 / 1 9 9 8 1 2 / 3 1 / 1 9 9 9 1 2 / 2 9 / 2 1 2 / 3 1 / 2 1 1 2 / 3 1 / 2 2 1 2 / 3 1 / 2 3 1 2 / 3 1 / 2 4 1 2 / 3 / 2 5 1 2 / 3 1 / 2 6 2000 4000 6000 8000 10000 12000 BSETHC Index UKX Index SPX Index NKY Index SHCOMP Index SENSEX Index

slide-48
SLIDE 48

48

MEHTA PARTNERS

Glossary

  • MCO: Managed Care Organization
  • PBM: Pharmacy Benefit Managers
  • NCE: Novel Chemical Entity
  • MS: Multiple Sclerosis
  • RA: Rheumatoid Arthritis
  • NICE: National Institute for Clinical Excellence
  • CMS: Centers for Medicare & Medicaid Services