
Financial results for the six months ended September 30, 2009 Appendix
November 6, 2009
1
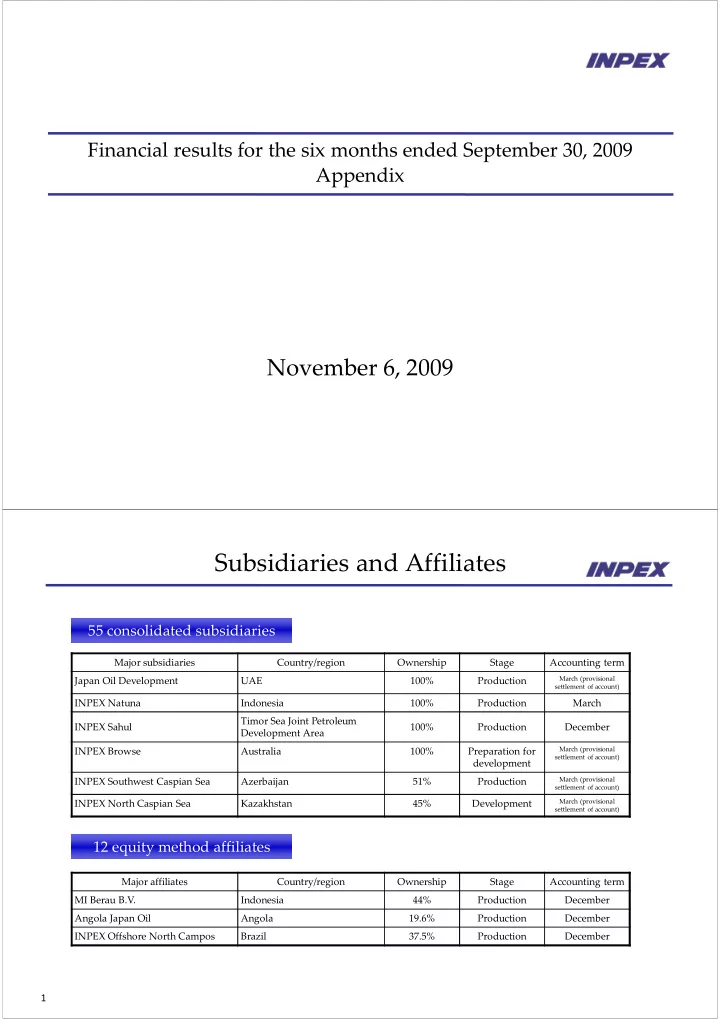
Subsidiaries and Affiliates
55 consolidated subsidiaries 12 equity method affiliates
Major subsidiaries Country/region Ownership Stage Accounting term Japan Oil Development UAE 100% Production
March (provisional settlement of account)
INPEX Natuna Indonesia 100% Production March INPEX Sahul Timor Sea Joint Petroleum Development Area 100% Production December INPEX Browse Australia 100% Preparation for development
March (provisional settlement of account)
INPEX Southwest Caspian Sea Azerbaijan 51% Production
March (provisional settlement of account)
INPEX North Caspian Sea Kazakhstan 45% Development
March (provisional settlement of account)
Major affiliates Country/region Ownership Stage Accounting term MI Berau B.V. Indonesia 44% Production December Angola Japan Oil Angola 19.6% Production December INPEX Offshore North Campos Brazil 37.5% Production December