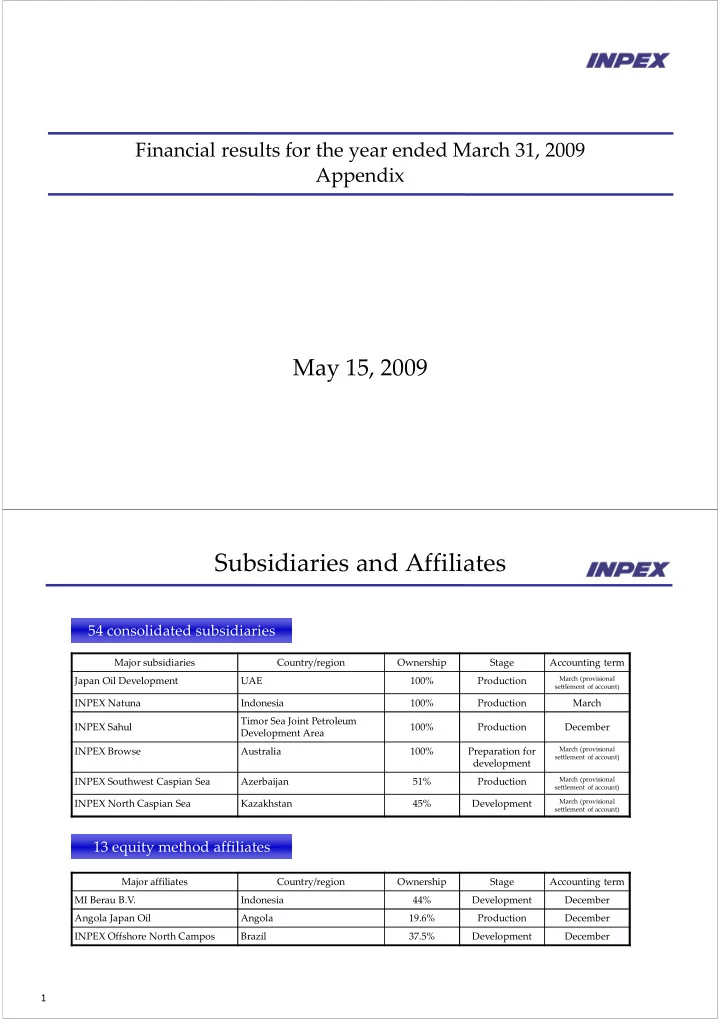
Subsidiaries and Affiliates 54 consolidated subsidiaries Major - - PDF document

subsidiaries and affiliates
SMART_READER_LITE
LIVE PREVIEW

Subsidiaries and Affiliates 54 consolidated subsidiaries Major - - PDF document

Financial results for the year ended March 31, 2009 Appendix May 15, 2009 Subsidiaries and Affiliates 54 consolidated subsidiaries Major subsidiaries Country/region Ownership Stage Accounting term March (provisional Japan Oil Development UAE


slide-1
SLIDE 1

Financial results for the year ended March 31, 2009 Appendix

May 15, 2009

1

Subsidiaries and Affiliates

54 consolidated subsidiaries 13 equity method affiliates

Major subsidiaries Country/region Ownership Stage Accounting term Japan Oil Development UAE 100% Production

March (provisional settlement of account)

INPEX Natuna Indonesia 100% Production March INPEX Sahul Timor Sea Joint Petroleum Development Area 100% Production December INPEX Browse Australia 100% Preparation for development

March (provisional settlement of account)

INPEX Southwest Caspian Sea Azerbaijan 51% Production

March (provisional settlement of account)

INPEX North Caspian Sea Kazakhstan 45% Development

March (provisional settlement of account)

Major affiliates Country/region Ownership Stage Accounting term MI Berau B.V. Indonesia 44% Development December Angola Japan Oil Angola 19.6% Production December INPEX Offshore North Campos Brazil 37.5% Development December

slide-2
SLIDE 2

2

Geographical segment information

For the year ended March 31, 2009 (April 1, 2008 through March 31, 2009) (Millions of yen)

Japan Asia/Oceania Eurasia (Europe ‐ NIS) Middle East/Africa Americas Total Eliminations and other Consolidated Net Sales

93,423 435,824 73,687 463,150 10,079 1,076,164 ‐ 1,076,164

Operating expenses

59,540 150,415 39,222 144,459 11,419 405,058 7,839 412,898

Operating income(loss)

33,882 285,408 34,464 318,691 (1,340) 671,106 (7,839) 663,266

Assets

208,326 409,559 365,913 189,270 85,168 1,258,236 509,808 1,768,044

Notes:

  • 1. Countries and areas are segmented based on their geographic proximity and their mutual operational relationships.
  • 2. Major countries and areas that belong to segments other than Japan are as follows:

(1) Asia ‐ Oceania・・・・・・・・・・Indonesia, Australia, East Timor, Vietnam (2) Eurasia (Europe ‐ NIS)・・・Azerbaijan, Kazakhstan, UK (3) Middle East ‐ Africa・・・・・UAE, D.R. Congo, Iran, Libya, Egypt, Algeria, Angola (4) Americas・・・・・・・・・・・・・・Venezuela, Ecuador, USA, Canada, Suriname, Brazil

  • 3. Unallocated operating expenses included in “Eliminations and other” of ¥11,129 million under the operating expenses are

mainly amortization of goodwill and general administrative expenses.

  • 4. Of the figure for assets, ¥513,129 million included in “Eliminations and other” are mainly asset concerned with goodwill, cash and deposit, marketable

securities and investment securities and those concerned with the administrative divisions.

3

LPG Sales

Sales volume (Mbbl) 1,549 2,067 518 33.5% Average unit price of overseas production ($/bbl) 62.00 68.03 6.03 9.7% Average unit price of domestic production(¥/ kg) 130 143 12 9.9% Average exchange rate (¥/$) 116.26 103.83 12.43

yen appreciation

10.7%

yen appreciation

  • Mar. ’08
  • Mar. ‘09

Change %Change Net Sales (Billions of yen) 12.1 15.8 3.7 30.9% Sales volume by region (Mbbl)

  • Mar. ’08
  • Mar. ‘09

Change %Change Japan 183 (17.4 thousand t) 191 (18.2 thousand t) 8 (0.8 thousand t) 4.6% Asia/Oceania 1,366 1,876 510 37.3% Eurasia (Europe/NIS ) ‐ ‐ ‐ ‐ Middle East/Africa ‐ ‐ ‐ ‐ Americas ‐ ‐ ‐ ‐ Total 1,549 2,067 518 33.5%

slide-3
SLIDE 3

4

EBIDAX

(Millions of yen)

  • Mar. ‘08
  • Mar. ‘09

Change Net income

173,245 145,062 (28,183)

P/L

Minority interests

21,204 725 (20,479)

P/L

Depreciation equivalent amount

134,944 95,450 39,494

Depreciation and amortization

36,181 42,966 6,785

C/F Depreciation under concession agreements and G&A

Amortization of goodwill

6,616 6,760 144

C/F

Recovery of recoverable accounts (capital expenditure)

92,147 45,724 (46,423)

C/F Depreciation under PS contracts

Exploration cost equivalent amount

57,785 46,010 11,775

Exploration expenses

34,095 25,982 (8,113)

P/L Exploration expense under concession agreements

Provision for allowance for recoverable accounts under production sharing

20,586 16,642 (3,944)

P/L Exploration expense under PS contracts

Provision for exploration projects

3,104 3,386 282

P/L Exploration expense under PS contracts

Material non‐cash items

(4,467) (7,797) (3,330)

Deferred income taxes

(5,502) (17,883) (12,381)

P/L

Foreign exchange loss

1,035 10,086 9,051

C/F

Net interest income, after tax

(62) (3,585) (3,523)

P/L After‐tax interest expense minus interest income

EBIDAX

382,649 275,865 (106,784)

5

Analysis of Recoverable Accounts under Production Sharing

(Millions of yen)

  • Mar. ‘07
  • Mar. ‘08
  • Mar. ‘09

Balance at beginning of period 295,075 319,149 383,162 Add: Exploration costs 9,791 27,459 23,643 Development costs 160,113 183,002 160,589 Operating expenses 46,683 52,697 55,929 Other 16 ‐ ‐ Less: Cost recovery (CAPEX) 105,949 92,147 45,724 Cost recovery (non‐CAPEX) 86,319 106,047 104,847 Other 262 951 18,830 Balance at end of period 319,149 383,162 453,922 Allowance for recoverable accounts under production sharing at end of period 51,190 71,445 87,828

slide-4
SLIDE 4

6

Profitability Indices

* Net ROACE=(Net income+Minority interests+(Interest expense‐Interest income)×(1‐Tax rate)) / (Average of sum of Net assets and Net debt at the beginning and end of the fiscal year). ** ROE=Net income/Average of Net assets excluding Minority interests at the beginning and end of the fiscal year.

Net ROACE* ROE**

14.6% 21.4%

  • Mar. '08
  • Mar. '09

11.9% 15.8%

  • Mar. '08
  • Mar. '09

7

Reserves/Production Indices

8.5 10.2 12.4 2 4 6 8 10 12 14

  • Mar. '07
  • Mar. '08
  • Mar. '09

(US$/boe)

Production Cost per BOE Produced

Finding & Development Cost per BOE (3‐year average)

6.9 17.5 28.3 5 10 15 20 25 30

  • Mar. '07
  • Mar. '08
  • Mar. '09

(US$/boe) 1.7 1.6 2.5 0.5 1 1.5 2 2.5 3

  • Mar. '07
  • Mar. '08
  • Mar. '09

(US$/boe)

SG&A Cost per BOE Produced

293 122 61 50 100 150 200 250 300 350

  • Mar. '07
  • Mar. '08
  • Mar. '09

(%)

Reserve Replacement Ratio (3‐year average)

slide-5
SLIDE 5

8

Net Production* (Apr. 2008 – Mar. 2009)

Oil/Condensate/LPG Natural Gas Total

405MBOE/day 223Mbbl/day 1,090MMcf/day (182MBOE/day)

8% 46% 6% 36% 4%

Japan Asia/Oceania Eurasia Middle East/Africa Americas

185 32 25 146 17

15% 8% 77%

Japan Asia/Oceania Americas

165 843 82

11% 20% 65% 2% 2%

Japan Asia/Oceania

Eurasia

MiddleEast/Africa Americas

5 45 25 146 3

* The production volume of crude oil and natural gas under the production sharing contracts entered by INPEX Group corresponds to the net economic take of our group.

9

Upside Potential from Proved + Probable Reserves*

* Proved reserve volumes are based on the reserves report (preliminary) by DeGolyer and MacNaughton applying SEC regulations. Probable reserve volumes are based on the reserves report (preliminary) by DeGolyer and MacNaughton applying SPE/WPC/AAPG/SPEE guideline (SPE‐PRMS) approved in March

  • 2007. The volumes are the sum of proved reserves and probable reserves by SPE‐PRMS after deduction of proved reserves by SEC regulations. Volumes

attributable to the equity method affiliates are included. ** Reserve Life = Proved (+Probable) Reserves as of March 31, 2009 / Production for the year ended March 31, 2009 (RP Ratio: Reserve Production Ratio)

1,114 484 484 484 3,176 3,176 1,114 1,114

500 1,000 1,500 2,000 2,500 3,000 3,500 4,000 4,500 5,000

Proved Developed Reseves Proved Undeveloped Reserves Proved Reserves Probable Reserves Proved + Probable Reserves

MMBOE

Reserve Life** (RP Ratio)

4,774

10.8 Years

32.3 Years

1,598

slide-6
SLIDE 6

Project Summary

11

FY 2010/03 Exploration Work Programs*

Japan ‐ Minami‐kuwayama (1) ** Indonesia ‐ Offshore Mahakam (2) ‐ Offshore South East Mahakam (1) Australia ‐ WA357P (1) ‐ WA255P (1) ‐ WA35L (2) ‐ WA281P (1) USA ‐ LSL (1) Libya ‐ 81‐2/82‐3 (2) ** ‐ 113‐3&4 (3) ** ‐ 042‐2&4 (1) Egypt ‐ South October (1) Kazakhstan ‐ Offshore North Caspian Sea (2)

※ Drilling one well since FY 2009/03

UK ‐ P799 (1) Exploration Expenditure*** (Billions of Yen) Exploratory Well (well) Seismic Survey 2D (km) Seismic Survey 3D (km2)

  • Mar. ‘09

59.0 24 4,303 1,834

  • Mar. ’10 (E)

45.0 24 1,280 4,474

* Number in ( ) is the number of drilling wells ** Operator Project *** Including acquisition costs

Venezuela ‐ Moruy II (1) Brazil ‐ BM‐C‐31 (1)

slide-7
SLIDE 7

12

Major Assets in Production & Development

WA‐285‐P Block (Ichthys) Block 18 JPDA06‐105 Block (Kitan) Ship Shoal 72 Main Pass 117/118 West Cameron 401/402 LSL 19320/19372 /19421/19574 WA‐35‐L (Van Gogh Field) Offshore D.R. Congo Block In Production In Development Undeveloped (Discovered) Preparation for Development (Discovered) WA‐10‐L Block (Griffin) Ohanet Block West Bakr Block El Ouar I/II Azadegan Oil Field North Caspian Sea Block (Kashagan Oil Field, etc.) ACG Oil Fields ADMA Block (Umm Shaif/Lower /Upper Zakum Oil Fields, etc.) Minami‐ Nagaoka Gas Field Sakhalin 1 ABK Block South Natuna Sea Block B Joslyn Oil Sands Project (Cut off mining area in Preparation for Development) Offshore Mahakam Block/ Attaka Unit Masela Block (Abadi) Berau Block (Tangguh Unit) Cuervito/ Fronterizo Blocks Copa Macoya/ Guarico Oriental Blocks

Offshore North Campos Frade Block

Albacora North West Java Block South East Sumatra Block JPDA03‐12 Block (Bayu‐Undan) WA‐155‐P(P1) (Ravensworth Field)

13

Production Start‐up Schedule

Production Start‐up Project/Oil & Gas Field Country Operator

Peak Production / Production Capacity

Our Share*1

April ’09 ‐ March ’10 Tangguh LNG Project Frade Oil Field Van Gogh Oil Field North Belut Gas Field Indonesia Brazil Australia Indonesia BP Chevron Apache

ConocoPhillips

7.6MMt/a 100Mbbl/d 60Mbbl/d ‐ *2 7.79% 6.85% 47.499% 35% April ’10 ‐ March ’11 Ravensworth Oil Field Australia BHPBP ‐ *2 28.5% April ’12 ‐ March ’13 Kashagan Oil Field Umm LuLu Oil Field Kazakhstan UAE NCOC

ADMA‐OPCO

1.5MMbbl/d ‐ *2 7.56% 12.0% After April ’14

Joslyn Oil Sand Project (Cut off mining)

Ichthys LNG Project (LNG) (Condensate) (LPG) Abadi LNG Project Nasr Oil Field Canada Australia Indonesia UAE TOTAL INPEX INPEX

ADMA‐OPCO

200Mbbl/d Over 8MMt/a

Approximately 100Mbbl/d Approximately 1.6MMt/a

Over 4.5MMt/a*3

‐ *2

10% 76% 100% 12.0% Discovered/ Production start‐up (TBD) Kuda Tasi / Jahal / Kitan Kalamkas, Aktote, Kairan and Southwest Kashagan structures El Ouar I&II JPDA Kazakhstan Algeria ENI NCOC ENI TBD TBD TBD 35% 7.56% 10.29% Phase 1 Full‐scale production (TBD)

Under initial stage production

Azadegan Oil Field Iran NICO 260Mbbl/d 10%

*1 Our share is a participating interest. In the case of an equity method affiliate, multiplying participating interest by our controlling share. *2 Nondisclosure because of confidentiality agreement with project partners *3 Phase 1 *4 North Caspian Operating Company

slide-8
SLIDE 8

14

Domestic Natural Gas Business

INPEX CORPORATION

Domestic gas LNG (regasified)

Domestic Pipeline Network

– Production* :

  • Natural gas: approximately 4.4 million m3/d
  • Crude oil: approximately 5,000 bbl/d

– Natural Gas Sales

  • Sales volume decrease by 2% from the previous fiscal

year

  • Expect more than 2 billion m3 of natural gas demand in

the mid‐to‐long term, while current demand is slowing down – Minami‐Nagaoka Gas Field (production commenced in 1984)

  • Promotion of development in the northern part of the

field by Massive Hydraulic Fracturing (MHF) Technology – Extension of pipeline network to meet increased gas expansion (approximately 1,400km in total)

  • Shin Oumi Line(67km/Approximately 23.8 billion yen/

completion at the end of Sep. 2009)

  • Gunma Interconnection Line (Planned with Tokyo Gas)

– Introduction of LNG

  • From Shizuoka Gas Co., Ltd. in 2010

– Construction of LNG receiving terminal in Joetsu City (Start‐ up target: 2014)

  • Design to establish Gas Supply Chain in our group

– Electric power business: approximately 55,000 kw

*sum of domestic crude oil and gas fields ; average daily volume (FY 2009/03)

15

Domestic Gas Price

Price Comparison per Unit

  • 20

40 60 80 100 120 140 98/4 99/4 00/4 01/4 02/4 03/4 04/4 05/4 06/4 07/4 08/4 09/4 Price (\/41.8605MJ)

Crude Oil CIF Japan LNG-CIF Japan Low Sulfur A Heavy INPEX Domestic Gas (Weighted Average)

* Conversion into unit price per 41.8605MJ (10,000kcal) by Crude Oil : 38.20MJ/L, A Heavy : 39.10MJ/L, LNG : 54.60MJ/kg from Statistics by METI * Refinement cost, etc. are not included in crude oil, Delivery cost, etc. are not included in A Heavy, Storage, Regasfied, Distribution costs, etc. are not included in LNG

slide-9
SLIDE 9

16

Offshore Mahakam

INPEX CORPORATION

Offshore Mahakam

Gas field Oil field Oil and gas field

Balikpapan Santan Terminal Attaka Unit

Sisi Field Nubi Field Bekapai Field Tunu Field

Makassar Strait Senipah Terminal

Handil Field Attaka Field Badak Field Nilam Field Peciko Field Tambora Field

* on the basis of all fields and average rate of March 2009

Bontang LNG/LPG Plant

– Participating Interest: 50% (Operator: TOTAL) – Production*

  • Crude Oil and Condensate: Approximately

77,000 bbl/d

  • Gas: Approximately 2.5 billion cf/d

– PSC: Until 2017 – Continue development activities to keep stable gas supply to Bontang LNG plant

  • Phased development of the Tunu / Peciko fields
  • Additional development of the Tambora field
  • Development of the Sisi‐Nubi fields

– Renewal of two LNG sales contracts to be expired in December 2010 and March 2011

17

South Natuna Sea Block B

INPEX Natuna, Ltd.

– Participating Interest: 35.0% (Operator : ConocoPhillips) – Production*:

  • Crude Oil: Approximately 64,000 bbl/d
  • LPG: Approximately 12,000 bbl/d
  • Gas: Approximately 500 million cf/d

– PSC: Until 2028 – Signed a gas sales contract for 22 years from 2001 with SembCorp (Singapore) and for 20 years from 2002 with Petronas (Malaysia) – Belanak commenced crude oil production in December 2004 and LPG production in April

  • 2007. Production started at Kerisi in December

2007. – Production is expected to start at North Belut in 3Q 2009.

Natuna Sea

South Natuna Sea Block

Natuna Island

West Belut South Belut North Belut Hiu Kerisi Belanak Belida Buntal Kijing Malong Sembilang

Oil field Gas field Oil & Gas field

Bintang Laut Keong Tembang Bawal

West Belut South Belut North Belut Hiu Kerisi Belanak Belida Buntal Kijing Malong Sembilang Bintang Laut Keong Tembang Bawal

A

B B A Oil field Gas field Oil & Gas field

* on the basis of all fields and average rate of March 2009

slide-10
SLIDE 10

18

Berau (Tangguh LNG Project)

MI Berau B.V. / MI Berau Japan Ltd.

West Papua Province (Indonesia)

Berau Block

Kaimana

– MI Berau B.V./MI Berau Japan Ltd.* : Joint venture with Mitsubishi Corporation (INPEX 44%, Mitsubishi 56%)

*MI Berau Japan owns approximately 16.5% share of KG Berau Petroleum Ltd.

– Participating Interest in the Berau PSC:

  • MI Berau : 22.9%(Tangguh Unit: 16.3%)
  • KG Berau Petroleum : 12%(Tangguh Unit: 8.56%)

(Operator : BP) – PSC: Until 2035 – Development plan and extension of the PS contract were approved by Indonesian Government – Signed loan agreements for total US$3.5 billion to finance the development of the LNG project – LNG plant (under construction) is scheduled to commence production in 2Q 2009

  • Scheduled to produce 7.6 million tons of LNG per year
  • Signed long‐term LNG sales contract for Fujian
  • Signed LNG sales contract with POSCO and K‐Power

Company

  • Entered into LNG sales contract with Sempra

19

Masela (Abadi)

INPEX Masela, Ltd.

Masela Block

Timor Sea JPDA Timor Sea

– Participating Interest: 100.0% – Operator: INPEX – PSC:

  • 10 year exploration period (until 2008)
  • 20 year development/ production period

(until 2028) – Discovered gas in Abadi‐1 exploration well in 2000 – Confirmed the extension of gas in the Abadi structure by 2 appraisal wells in 2002 – Drilled 4 appraisal wells from May 2007 to evaluate reserves – Submitted Plan of Development (POD) to Indonesian Government (BPMIGAS) in Sep. 2008 and acquired the approval from the Indonesian Government – INPEX proposal

  • Floating LNG concept
  • Production capacity: annual average of 4.5

MM tons of LNG for more than 30 years

  • Start‐up target: around 2016
slide-11
SLIDE 11

20

JPDA03‐12 (Bayu‐Undan)

INPEX Sahul, Ltd.

– Participating Interest: 11.27%* (Operator: ConocoPhillips) – Production*:

  • Oil / Condensate: Approximately 61,000

bbl/d

  • LPG: Approximately 36,000 bbl/d
  • Gas: Approximately 1.1 billion cf/d

– PSC: Until 2022 – Sales of condensate and LPG started in February 2004 – Entered into LNG Sales Contract with TEPCO and Tokyo Gas in August 2005 (3 million t/a for 17 years from 2006) – LNG sales started in February 2006

Darwin

Bayu‐Undan Gas/Condensate Field Timor Sea

Joint Petroleum Development Area

JPDA03‐12 Block

Australia Indonesia

50 km

* on the basis of all fields and average rate of March 2009

21

WA‐285‐P (Ichthys)

INPEX Browse, Ltd.

– Participating Interest: 76.0% – Operator: INPEX – Concession Agreement:

  • Exploration Period until September 2009
  • Production Period for 21 years from the grant of the production

license (with the option to extend the contract period) – Confirmed a large‐scale gas and condensate field in total six exploratory wells from 2000 and called “Ichthys” – Commenced Australian federal and West Australian state government approval processes for assessment of environmental impact of the Ichthys project in May 2006 – The Australian Government awards Major Project Facilitation(MPF) status to Ichthys project in August 2006, as it provides a significant boost to Australia’s employment and exports – Drilled the exploration wells (Dinichthys North‐1 since April 2007 and Ichthys West‐1 since April 2008) with the aim of expansion of the gas reserves (8 exploration wells in total) – Commenced Australian federal and Northern Territory government approval processes for assessment of environmental impact of the Ichthys project in May 2008 – Selected Darwin, Northern Territory as liquefied natural gas plant site in September 2008 – Started FEED work of the natural gas liquefaction plant in January 2009 – Started FEED work of the offshore facilities in April 2009 – Opened Darwin office in April 2009 – Plan to initially produce over 8 million t/a of LNG and approximately 100 thousand bbl/d of condensate and 1.6 million t/a year of LPG

WA‐285‐P (Ichthys)

PAPUA NEW GUINEA

AUSTRALIA

slide-12
SLIDE 12

22

Permits Location – Ichthys(WA‐285‐P) and others

Wickham Point (Darwin LNG) Proposed site Middle Arm Peninsula 23

JPDA06‐105 (Kitan Oil Field)

INPEX Timor Sea, Ltd.

– Participating Interest: 35%(Operator: Eni) – PSC: Until September 2011 – Drilled 6 exploration wells and 3 appraisal wells since 1994 (9 wells in total) – Discovered oil in Kitan‐1 and Kitan‐2 in March 2008 – Declaration of commercial discovery of Kitan Oil Field in April 2008 – Development plan for Kitan Oil Field is to be submitted to the National Petroleum Authority of Timor‐Leste in May 2009 Kitan Oil Field JPDA06‐105 Block

50 km

Bayu‐Undan Gas/Condensate Field

Timor Sea

Joint Petroleum Development Area

slide-13
SLIDE 13

24

WA‐35‐L (Van Gogh Oil Field)

INPEX Alpha, Ltd.

– Participating Interest:47.499% (Operator: Apache) – Concession Agreement:

  • Acquired the production license in October 2008

– Final investment decision in April 2007 – Under development with a plan to start production in 4Q 2009

Van Gogh Oil Field

Van Gogh Defined Area (WA‐35‐L Block)

Coniston Structure

Ravensworth Oil Field Griffin Oil Fields

WA‐35‐L Block

Australia

Onslow Exmouth

25

WA‐155‐P (Part I) (Ravensworth Oil Field) INPEX Alpha, Ltd.

– Participating Interest: 28.5 % (Operator :BHPBP) – Concession Agreement:

  • Applying for the production license

– Making unitized development plan including Crosby Field and Stickle Field in WA‐12‐R, next to WA‐155‐P – Final investment decision in November 2007 – Under development work with a plan to start production in 3Q 2010

Van Gogh Defined Area (WA‐35‐L Block)

Coniston Structure

Griffin Oil Fields

Australia

Onslow Exmouth

Ravensworth Oil Field

WA‐155‐P (Part 1) Block

slide-14
SLIDE 14

26

ACG

INPEX Southwest Caspian Sea, Ltd.

ACG

Azerbaijan Baku

Kazakhstan The Aral Sea Uzbekistan Russia Turkmenistan Armenia Azerbaijan Georgia Iran The Caspian Sea 500km

The Caspian sea

50km

ACG

Deepwater portion

  • f Gunashli

Chirag Azeri

– Participating Interest: 10.0% (Operator: BP) – Production *1,2: Approximately 790,000 bbl/d – PSC: Until 2024 – Phase 1 : Starting oil production in the Central Azeri area in February 2005 – Phase 2 : Starting oil production in the West Azeri area in December 2005 and in the East Azeri area in October 2006 – Phase 3 : Starting oil production in the Deepwater portion of Gunashli area in April 2008

*2. The production rate was temporarily reduced to handle gas leakage

  • ccurred at the Central Azeri Platform on September 17, 2008. We have

been taking measures to recover to the original production volumes

*1 on the basis of all fields and average rate of March 2009

27

Kashagan, etc.

INPEX North Caspian Sea, Ltd.

Kairan Structure

Caspian Sea

Aktote Structure Kashagan Southwest Structure Kashagan Structure

Russia Kazakhstan China India Turkey Iran

Kalamkas Structure

– Participating Interest: 7.56% – PSC: Until the end of 2021* – Discovered crude oil in Kashagan in June 2000 – In addition to Kashagan structure, existence of hydrocarbon was confirmed in Kalamkas, Aktote, Kairan and Southwest Kashagan structures – Concluded a final agreement in October, 2008 with Kazakhstan authority – Established a new joint operating company (North Caspian Operating Company). NCOC took over the

  • peratorship from Agip KCO in January 2009

– Production start target: end of 2012 – At the Experimental Program stage, production rate will be 300 thousand bbl/d and further increase to 450 thousand bbl/d. At the Kashagan full field development stage, a peak rate of 1.5 million bbl/d is planned towards the end of the next decade

*We have the options to extend the contract period by 20 years

slide-15
SLIDE 15

28

BTC(Baku‐Tbilisi‐Ceyhan) Pipeline Project

INPEX BTC Pipeline, Ltd.

– Participating Interest: 2.5% (Operator : BP) – Obtained stock of the operating company (BTC Co.) through INPEX BTC Pipeline, Ltd. in October 2002 – Signed project finance contract to raise capital for the construction of the pipeline in February 2004 – Commenced crude oil export in June 2006 from Ceyhan terminal – Complete commissioning work 1 million bbl/d capacity in 2007 2Q – Cumulative export volume reached 580 MM bbls by the end of March 2009 – 1.2 million bbl/d capacity expansion project will be completed by 2Q 2009

BTC Pipeline

Tbilisi

Black Sea RUSSIA GEORGIA Caspian Sea Mediterranean Sea TURKEY SYRIA IRAQ IRAN

Ceyhan

CYPRUS AZERBAIJAN ARMENIA

Baku 29

ADMA

Japan Oil Development Co., Ltd. (JODCO)

– Umm Shaif / Lower Zakum  Participating Interest: 12.0% (Operator : ADMA‐OPCO*) – Upper Zakum / Umm Al‐Dalkh / Satah  Participating Interest: Upper Zakum / Umm Al‐Dalkh: 12.0% Satah: 40.0% (Operator : ZADCO*) – Concession Agreement: Until 2018 (Contract of Upper Zakum extended from 2018 to 2026) – Continuous development to keep and increase the production level by  Water injection to all the fields  Gas injection to Umm Shaif / Lower Zakum fields  Making development plans of 4 promising undeveloped structures  Installing new gas injection facility (Umm Shaif) and additional gas processing facility (Lower Zakum)  Making redevelopment plan using artificial islands (Upper Zakum)

*Operating company established by ADNOC and other companies including JODCO. JODCO has 12% interest in each company.

Abu Dhabi

Production Oil Field

Zirku Island

Satah Oil Field ADMA Block Umm Shaif Oil Field Lower/Upper Zakum Oil Field Umm Al‐Dalkh Oil Field

Das Island

Underwater pipeline

slide-16
SLIDE 16

30

Azadegan

Azadegan Petroleum Development, Ltd

– Participating Interest: 10% (Continuing discussions in detail with Iranian side) – Service Contract (Buyback Contract) – Two Phase Oil Field Development Project*  In phase 1, planned to reach 150,000 bbl/d in 2013  In case we move on to phase 2, planned to reach 260,000 bbl/d after 2017

*All field base; timing of production start on the premise that the development work start within late 2009, which could be changed based on the situation

Azadegan Oil Field

Tehran Baghdad Ahwaz Kuwait

Iraq Iran

100km

31

Venezuela Projects

Teikoku Oil & Gas Venezuela, C.A., etc

* on the basis of all fields and average rate of March 2009

**Joint venture company with PETROBRAS (50:50)

Copa Macoya / Guarico Oriental Blocks – INPEX’s Share

  • Gas JV : 70% Oil JV : 30%

– Joint Venture Agreement: 2006‐2026 – Production volume*

  • Gas: Approximately 78 million cf/d
  • Crude oil: Approximately 2,000bbl/d

Moruy II Block – Participating Interest: 50% (Operator) – Preparing to drill the 1st exploration well

Caracas Venezuela

Teikoku Oil & Gas Venezuela, C.A.

Copa Macoya / Guarico Oriental Blocks

PT Moruy II, S.A. ** Moruy II Block

slide-17
SLIDE 17

32

Frade

Frade Japão Petróleo Limitada (FJPL)

–FJPL’s Participating Interest: 18.3% (Operator : Chevron)

*FJPL is an equity method affiliate of INPEX. (INPEX owns 37.5% shares of FJPL through a subsidiary)

–Concession Agreement: Until 2025 –Final investment decision was made in June 2006 –Scheduled to start production in the middle of 2009 –Daily production of approximately 100 thousand bbl/d at peak production

Frade Block

Campos Macae Rio de Janeiro Frade Roncador Albacora Leste Albacora Marim

Frade FPSO

33

Gulf of Mexico (USA) Projects

Teikoku Oil (North America) Co., Ltd.

– Gas and oil exploration and development project – Concession Agreement (Lease) – Participating Interest:

  • Ship Shoal 72: 25%
  • West Cameron 401/402: 25%
  • Main Pass 117/118: 10%
  • LSL 19372: 18.75%

– Production volume*

  • Gas: Approximately 39 million cf/d
  • Crude oil: Approximately 1,500bbl/d

LSL 19372

* on the basis of all fields and average rate of March 2009

slide-18
SLIDE 18

34

100km

Pipeline (OCP)

Pipeline (SOTE)

Ecuador

Quito Esmeraldas

Block 18

TEIKOKU OIL ECUADOR

TEIKOKU OIL ECUADOR Block 18

– Participating Interest: 40% (Operator: PETROBRAS) – Concession Agreement: 2002‐2022 – Production Volume* : Approximately 33,000bbl/d – Approval for the acquisition of a interest by the Ecuadorian authority on October 27, 2008 – Reached a final agreement with Petrobras Energia S.A. (PESA) to acquire a participating interest on December 16, 2008

* on the basis of all fields and average rate of March 2009

35

Joslyn Oil Sands Project INPEX Canada, Ltd.

7280060T24 7405070799 7404110452

(220km2)

– Participating Interest:

  • Upstream project: 10% (operator: TOTAL)
  • Upgrader Project: 7.14% (operator: TOTAL)

– Concession Agreement (Lease)

  • 7280060T24 : Indefinite
  • 7404110452 : 15 year primary lease from Nov 2004*
  • 7405070799 : 15 year primary lease from Jul 2005*

*Will be extended

– Oil Sands Upstream Project:

  • Started production in late 2006 using SAGD technology but

decided to suspend SAGD operation in February 2009 and suspended production in March 2009

  • Planning a large scale development by mining technology:

Around 100 thousand barrels of bitumen per day in the next decade as the first phase, followed by additional 100 thousand barrels of bitumen per day as the second phase – Upgrader Project:

  • Planning construction of the upgrader plant with a

production capacity of 130 thousand barrels of synthetic oil per day in Edmonton, Alberta in the next decade as the first phase

slide-19
SLIDE 19

36

Offshore D.R. Congo

Teikoku Oil (D.R. Congo) Co., Ltd.

– Participating Interest: 32.28% (Operator: Perenco) – Concession Agreement: 1969‐2023 – Production Commencement: 1975 – Production volume*: Approximately 16,000 bbl/d

Offshore D.R. Congo Block

* on the basis of all fields and average rate of March 2009

37

Egypt Projects

The Egyptian Petroleum Development Co., Ltd.*, etc.

* INPEX’s share 52.7% ** on the basis of all fields and average rate of March 2009

Cairo

River Nile Cairo The Egyptian Petroleum Development Co., Ltd. (EPEDECO)* West Bakr Block Teikoku Oil Suez SOB South October Block

West Bakr Block – Participating Interest: 100%(Operator) – PSC: 1975‐ 2020+5years option – Production commencement: 1980 – Production volume**: Approximately 4,000bbl/d South October Block – Participating Interest: 35% (Operator: Dana Petroleum) – PSC: 2005‐2010 – Interpreting geological data North Qarun Block – Participating Interest: 25% (Operator: Dana Petroleum) – PSC: 2005‐2009 – Interpreting geological data

Teikoku Oil Nile NQR North Qarun Block

slide-20
SLIDE 20

38

Algeria Projects

Japan Ohanet Oil & Gas Co., Ltd. */ Teikoku Oil (Algeria) Co., Ltd.

* INPEX’s share 15% ** on the basis of all fields and average rate of March 2009

Teikoku Oil (Algeria) El Ouar I/II Blocks Japan Ohanet Oil & Gas (JOOG)* Ohanet Block

Algeria

Ohanet Block – JOOG’s interest: 30% (Operator: BHPB) – Risk Service Contract: 2000‐2011 – Production commencement: Oct. 2003 – Production volume**

  • Dry Gas: Approximately 547 million cf/d
  • Condensate: Approximately 22,000 bbl/d
  • LPG: Approximately 22,000 bbl/d

El Ouar I/II Blocks – Participating Interest: 10.29%(Operator: ENI) – Concession Agreement (production phase period: 15years+5years option) – Finalizing a development plan (oil and gas/condensate) for approval of the Algerian authority

39

Libya Projects

Teikoku Oil Libya UK Ltd / IPEX Libya, Ltd.

– Participating Interest

  • 81‐2 Block, 82‐3 Block: 73%(Operator)
  • 42‐2&4 Block: 40%(Operator: TOTAL)
  • 113‐3&4 Block: 85% (Operator)

– PSA:

  • 81‐2 Block / 82‐3 Block / 42‐2&4 Block :

2005‐2010

  • 113‐3&4 Block : 2007‐2012

– Drilling Exploratory wells (81‐2 Block / 82‐3 Block) – Interpreting geological data (42‐2&4 Block) – Preparing for drilling exploration wells (113‐3&4 Block)

Tripoli Benghazi

Libya

Algeria Tunisia Egypt Chad Sudan

Mediterranean

42-2&4 Block 81-2 Block, 82-3 Block 113-3&4 Block

slide-21
SLIDE 21

40

Sakhalin I Sakhalin Oil and Gas Development Co.

Chayvo Structure Arkutun‐Dagi Structure Odoptu Structure

Val

5 10 Kilometers

Gas Field Oil Field

Sakhalin Island

– Sakhalin Oil and Gas Development Co. (SODECO): INPEX Holdings owns 5.75% of the total share

(Under consideration to purchase resulting to own up to 33% of the SODECO’s share from the Ministry of Economy, Trade and Industry which has inherited a 50% of the SODECO’s shares from JNOC)

– SODECO’s Participating Interest: 30.0% – Production*:

  • Crude Oil : Approximately 190,000 bbl/d
  • Gas: Approximately 907 million cf/d

– Operator: ExxonMobil – Partners: ONGC Videsh, Sakhalinmorneftegas‐Shelf, RN‐ Astra – PSC: In Dec. 2001, “Commerciality Declaration” of the project was authorized by the Russian government and the project moved into development phase for 20 years – Commenced production in Oct. 2005; commenced crude

  • il export in October 2006

– Commenced natural gas supply to Russian domestic market, and considering natural gas supply to Chinese and other markets

* on the basis of all fields and average rate of March 2009

41

East China Sea INPEX CORPORATION

– 1969: Application for exploration rights – 1981, 1984: Seismic survey – 1992: Discovery of Pinghu by CNOOC, Production commencement in 1998 – 1997~1999: Seismic survey by JNOC – 2004~2005: Seismic survey by JOGMEC –

  • Apr. 2005: Starting a procedure for granting

exploration rights by METI, we submitted a request to accelerate the procedure on 3 Areas (Approximately 400km2) in the application Areas (42,000km2) to Kyushu Bureau of METI –

  • Aug. 2005: Granted exploration rights of 3 Areas by

MITI –

  • Jun. 2008:Japan and China reached a political

agreement on how and where to conduct joint exploration in the East China Sea. – Discussions on the details of the joint exploration and procedures are underway between the governments. We are continuously monitoring the outcome of the talks and preparing to begin work for exploration on consultation with Japanese local authorities.

slide-22
SLIDE 22

42

Japan

  • INPEX CORPORATION

Minami‐Nagaoka, etc. * Japan Concession ー Asia/Oceania

  • INPEX CORPORATION

Mahakam Indonesia PS ー

  • INPEX Natuna

South Natuna Block ‘B‘ Indonesia PS 100%

  • MI Berau B.V.

Berau(Tangguh LNG Project) Indonesia PS 44%

  • INPEX Masela

Masela(Abadi)* Indonesia PS 50.84%

  • INPEX Sahul

Bayu‐Undan JPDA PS 100%

  • INPEX Browse

WA‐285‐P(Ichthys)* etc. Australia Concession 100%

  • INPEX Timor Sea

JPDA 06‐105(Kitan)

JPDA

PS 100%

  • INPEX Alpha

Van Gogh, Ravensworth etc. Australia Concession 100% Eurasia (Europe ‐ NIS)

  • INPEX Southwest Caspian Sea

ACG Azerbaijan PS 51%

  • INPEX North Caspian Sea

Kashagan Kazakhstan PS 45%

Key Investments and Contracts I

Company Field / Project Name Country Contract Type Ownership Stage

Note: *Operator project

43

The Middle East

  • JODCO

ADMA(Upper Zakum, etc.) UAE Concession 100%

  • Azadegan

Azadegan Iran Service 100% Africa

  • Teikoku Oil (D.R. Congo)

Offshore D.R.Congo D.R.Congo Concession 100%

  • The Egyptian Petroleum Development

West Bakr* Egypt PS 52.7%

  • Teikoku Oil Suez SOB

South October Egypt PS 100%

  • Teikoku Oil Nile NQR

North Qarun Egypt PS 100%

  • Japan Ohanet Oil & Gas

Ohanet Algeria Service 15%

  • Teikoku Oil (Algeria)

El Ouar I/II Blocks Algeria Concession 100% Under discussion for Development

  • Teikoku Oil Libya UK Ltd

81‐2/82‐3* Libya PS 100%

  • INPEX Libya

42‐2&4/113‐3&4* Libya PS 100% Americas

  • INPEX Canada

Joslyn Oilsand Canada Concession 100%

  • Teikoku Oil & Gas Venezuela

Copa Macoya* / Guarico Oriental Venezuela JV 100%

  • PT Moruy II, S.A.

Cuervito / Fronterizo Venezuela JV 50%

  • Teikoku Oil (North America)

Ship Shoal 7 2etc. USA Concession 100%

  • Frade Japão Petróleo Limitada

Frade Brazil Concession 37.5%**

  • Teikoku Oil Ecuador

Block 18 Ecuador Concession 100%

Note: *Operator project ** Frade Japão Petróleo Limitada is subsidiary of INPEX Offshore North Campos (INPEX’s equity method affiliate). 37.5% of ownership means indirect investment from INPEX through INPEX Offshore North Campos.

Key Investments and Contracts II

Company Field / Project Name Country Contract Type Ownership Stage

slide-23
SLIDE 23

Others

45

Proved Reserves* (compared to global E&P companies)

10,458 9,975 2,401 1,598 1,195 1,207 1,375 1,328 2,277 2,439 2,977 6,600 10,678 11,196 1,432 5,584 18,147 21,115 41% 66% 57% 49% 30% 54% 58% 51% 39% 74% 45% 27% 66% 68% 44% 39% 53% 32% 59% 34% 43% 52% 62% 46% 42% 49% 61% 26% 55% 73% 34% 56% 84% 61% 47% 1,000 2,000 3,000 4,000 5,000 6,000 7,000 8,000 9,000 10,000 11,000 12,000 22,000 Exxon Mobil (UK) BP (UK) Chevron (US) RD Shell (UK/NL) Total (FR) ConocoPhillips (US) ENI (IT ) StatoilHydro (NO) Occidental(US) Apache (US) BG (UK) Anadarko (US) INPEX Hess (US) BHP Billiton (AU) Woodside (AU) Talisman (CA) Marathon (US) MMBOE

Crude Oil/Condensate/LPG Natural Gas

16%

Source: Most recent publicly available information Note :* Reserve Data as of December 31, 2008, except for INPEX (as of March 31, 2009) and BHP Billion (as of June, 2008) in accordance with SEC regulations. Assets DeGolyer and MacNaughton did not evaluate are not included. Proved reserve volumes are based on the reserves report (preliminary) by DeGolyer and MacNaughton applying SEC regulations and amounts attributable to the equity method affiliates are included. Government‐owned companies are not included.

slide-24
SLIDE 24

46

Production Volume* (compared to global E&P companies)

2,212 1,797 603 405 381 355 223 343 354 536 1,751 561 3,921 2,341 2,503 3,121 3,818 53% 62% 57% 61% 62% 66% 54% 63% 61% 77% 39% 50% 55% 50% 57% 53% 66% 43% 47% 34% 45% 50% 47% 50% 39% 37% 46% 34% 38% 39% 43% 38% 71% 23% 61% 200 400 600 800 1,000 1,200 1,400 2,500 4,500

Exxon Mobil (US) BP (UK) RD Shell (UK/NL) Chevron (US) Total (FR) ConocoPhillips (US) ENI (IT) StatoilHydro (NO) BG (UK) Occidental (US) Anadarko (US) Apache (US) INPEX Hess (UK) BHP Billiton (AU) Talisman (CA) Marathon (US) Woodside (AU)

Thousand BOE/d

Crude Oil/Condensate/LPG Natural Gas

622 29%

Source: Most recent publicly available information * Production data for the year ended December 31, 2008, except for INPEX (for the year ended March 31,2009) and BHP Billion (for the year ended June 30, 2008). Production figures are in accordance with SEC regulations. Amounts attributable to the equity method are included. Government‐owned companies are not included.

47

Factor Analysis of Change in Proved Reserves*

1,645 1,598 (147) 80 (17) (1) 44 (6) 200 400 600 800 1,000 1,200 1,400 1,600 1,800 2,000

(MM BOE)

Impact of Change in Oil Prices

  • Mar. ‘09

Production in the Year ended March 31, 2009 Revisions of previous estimates

  • Mar. ‘08

Extensions and Discoveries** Downgrade to Probable Reserves (+) (-)

* Proved reserve volumes are based on the reserves report (preliminary) by DeGolyer and MacNaughton applying SEC regulations. Volumes attributable to the equity affiliates are included. ** Including acquisitions and sales

slide-25
SLIDE 25

48

Factor Analysis of Change in Probable Reserves*

2,721 223 (152) (42) 425 1 3,176 500 1,000 1,500 2,000 2,500 3,000 3,500 4,000 4,500

(MM BOE)

Revisions of previous estimates

  • Mar. ‘08

Extensions and Discoveries** Impact of Change in Oil Prices

  • Mar. ‘09

Transfer from Proved Reserves (+) (-)

* Probable reserve volumes are based on the reserves report by DeGolyer and MacNaughton (preliminary) in accordance with SPE/WPC/AAPG/SPEE guideline (SPE‐PRMS). The volumes are the sum of proved reserves and probable reserves by SPE‐PRMS after deduction of proved reserves by SEC

  • regulations. Volumes attributable to the equity method affiliates are included.

** Including acquisitions and sales.

49

Definition of Proved Reserves

– Our definition of proved reserves is in accordance with the SEC Regulation S‐X, Rule 4‐10, which defines proved reserves as the estimated quantities of oil/gas which can be recovered with reasonable certainty in future years under current economic and operational conditions based on geographical and engineering data – To be classified as a proved reserve, the SEC rule requires a market and means of economical production/processing/shipping to exist already or to become available in near future. Thus, this definition is known to be the most conservative among the various definitions of reserves used in the oil and gas industry – The SEC rule separates proved reserves into two categories; proved developed reserves which can be recovered by existing wells and infrastructure, and proved undeveloped reserves which require future development of wells and infrastructure to be recovered

slide-26
SLIDE 26

50

Definition of Probable Reserves

– Probable reserves, which term is defined by SPE/WPC/AAPG/SPEE, are those unproved reserves which analysis of geological and engineering data suggests are more likely than not to be recoverable – In this context, when probabilistic methods are used, there should be at least a 50% probability that the quantities actually recovered will equal or exceed the sum of estimated proved plus probable reserves – The difference from the definition of proved reserves based on the SEC rule is whether oil/gas can be commercially recovered with reasonable certainty. Some part of the probable reserves are expected to be upgraded to proved reserves by the progress of project maturity (commitment of financing, establishment of sales agreements etc.) and reduction in technical uncertainty by addition

  • f new technical data.

51

Production Sharing Contracts

: Host Country Take : Subject to Tax : Not Subject to Tax

  • 1. Cost Recovery Portion

 Non‐capital expenditures incurred for production and recovered during the current period  Scheduled depreciation of the capital expenditures for the current period and recovered during the current period  Recoverable costs that have not been recovered in the previous periods

  • 2. Equity Portion (Profit Oil)

Contractor Take Host Country Share Contractor Share Cost Recovery Portion Host Country Profit Oil Contractor Profit Oil

slide-27
SLIDE 27

52

Accounting on Production Sharing Contract

Cash Out Assets on Balance Sheet Income Statement

SG&A  Depreciation and amortization Cost of sales  Recovery of recoverable accounts under production sharing (Capital expenditures) Project under exploration phase Provision for allowance for recoverable accounts under production sharing Project under development and production phase Project under development and production phase Other Expenses  Amortization of exploration and development rights Recoverable accounts under production sharing Recoverable accounts under production sharing Exploration and development rights Acquisition Costs Production Costs (Operating expenses) Development Expenditures Exploration Expenditures Cost of sales  Recovery of recoverable accounts under production sharing (Non‐ Capital expenditures) 53

Accounting on Concession Agreement

Cash Out

Production Costs (Operating expenses) Exploration Expenditures Tangible Fixed Assets

Income Statement

Exploration expenses Cost of sales (Depreciation and amortization) Cost of sales (Operating expenses) Cost of sales (Depreciation and amortization) All exploration costs are expensed as incurred

Assets on Balance Sheet

All production costs are expensed as incurred Acquisition Costs Development Expenditures Mining Rights

slide-28
SLIDE 28

54

Crude Oil Price

30 40 50 60 70 80 90 100 110 120 130 140 150

Apr. May Jun. Jul. Aug. Sep. Oct. Nov . Dec. Jan. Feb. Mar. Apr. May Jun. Jul. Aug. Sep. Oct. Nov . Dec. Jan. Feb. Mar.

Brent WTI Dubai

($)

2007 2008

Apr.’07‐

  • Mar. ’08

2008 2009

Apr.’08‐

  • Mar. ’09

Average Apr. May Jun. Jul. Aug. Sep. Oct. Nov. Dec. Jan. Feb. Mar. Average

Brent 82.14 110.48 124.69 133.73 134.56 115.24 100.79 73.68 54.75 43.05 45.71 43.87 47.42 85.66 WTI 82.25 112.46 125.46 134.02 133.48 116.69 103.76 76.72 57.44 42.04 41.92 39.26 48.06 85.94 Dubai 77.36 103.41 119.50 127.82 131.27 112.86 95.90 67.42 49.84 40.53 44.12 43.09 45.59 81.78 2009