
SLIDE 1
Sub-/Seismic Structure and Deformation Quantification on different scales
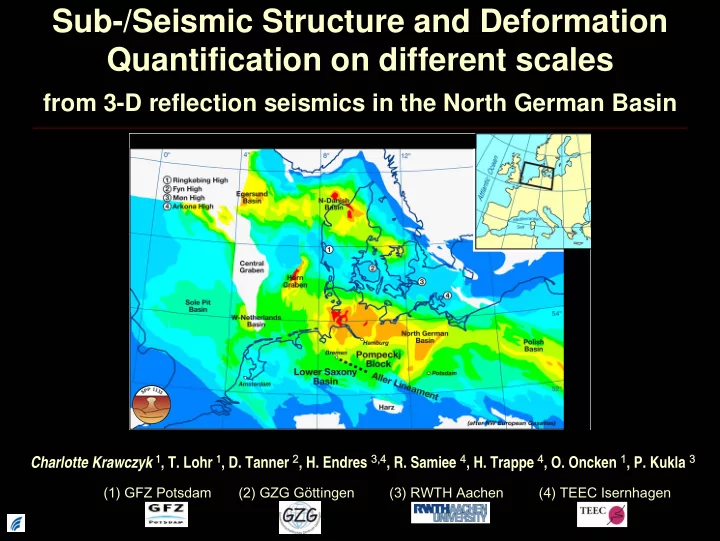
from 3-D reflection seismics in the North German Basin
Charlotte Krawczyk 1, T. Lohr 1, D. Tanner 2, H. Endres 3,4, R. Samiee 4, H. Trappe 4, O. Oncken 1, P. Kukla 3
(1) GFZ Potsdam (2) GZG Göttingen (3) RWTH Aachen (4) TEEC Isernhagen