Study that Evaluates Interface Design using Gaze Entropy Yejin Lee a - - PDF document

study that evaluates interface design using gaze entropy
SMART_READER_LITE
LIVE PREVIEW

Study that Evaluates Interface Design using Gaze Entropy Yejin Lee a - - PDF document

Transactions of the Korean Nuclear Society Virtual Spring Meeting July 9-10, 2020 Study that Evaluates Interface Design using Gaze Entropy Yejin Lee a , Hyun-Chul Lee b a SA Monitoring and Mitigation Research Team, KAERI, 34057, Daejeon, S.


slide-1
SLIDE 1

Transactions of the Korean Nuclear Society Virtual Spring Meeting July 9-10, 2020

Study that Evaluates Interface Design using Gaze Entropy

Yejin Lee a, Hyun-Chul Lee b

a SA Monitoring and Mitigation Research Team, KAERI, 34057, Daejeon, S. Korea b SA Monitoring and Mitigation Research Team, KAERI, 34057, Daejeon, S. Korea *Corresponding author: yejinlee@kaeri.re.kr

  • 1. Introduction

Since the 1950s, eye tracking has been used in the field

  • f psychology to measure human unconscious reactions

and behaviors (Park, 2016). It has been spotlighted as a representative physiological measurement tool that can implicitly measure the user's thoughts. Many studies have utilized eye tracking to effectively read the thoughts from the subject's visual characteristics and understand their behavior. Eye tracking measures include the fixation time, initial fixation, fixation rate, fixation frequency, and pupil size. And there’s visualization method such as Gazeplot and Heatmap. Gazeplot visualizes the order of fixation and the position value, making it easy to understand the movements by the user's gaze order. However, it is difficult to compare the characteristics of the gaze path because it cannot derive quantitative values. In the case of Gazeplot, there is no way to know exactly how dispersive the order in which the gaze occurred, in what pattern, and the order in which each gaze was formed is displayed as a number, but if many gazes are generated, the value of the gaze are displayed as overlapping. This has the disadvantage that it is difficult to grasp the pattern and dispersion degree of the gaze. Similarly, in the case of the heatmap, it is possible to grasp the tendency of fixation time or readers can see at a glance which parts of the screen participants dwelled on the most, but it is difficult to quantify the degree of dispersion in the eye gaze data. To overcome this, several studies have been conducted to introduce the concept of entropy in Gazeplot and Heatmap to see the degree of dispersion or attention of the gaze. In this study, we tried to understand the trends in the fields that have been studied up to now and derive the characteristics of gaze entropy through research cases where gaze entropy was utilized. Also, through this, we determined how to use gaze entropy in future interface design evaluations.

  • 2. Examples of use of gaze entropy by field

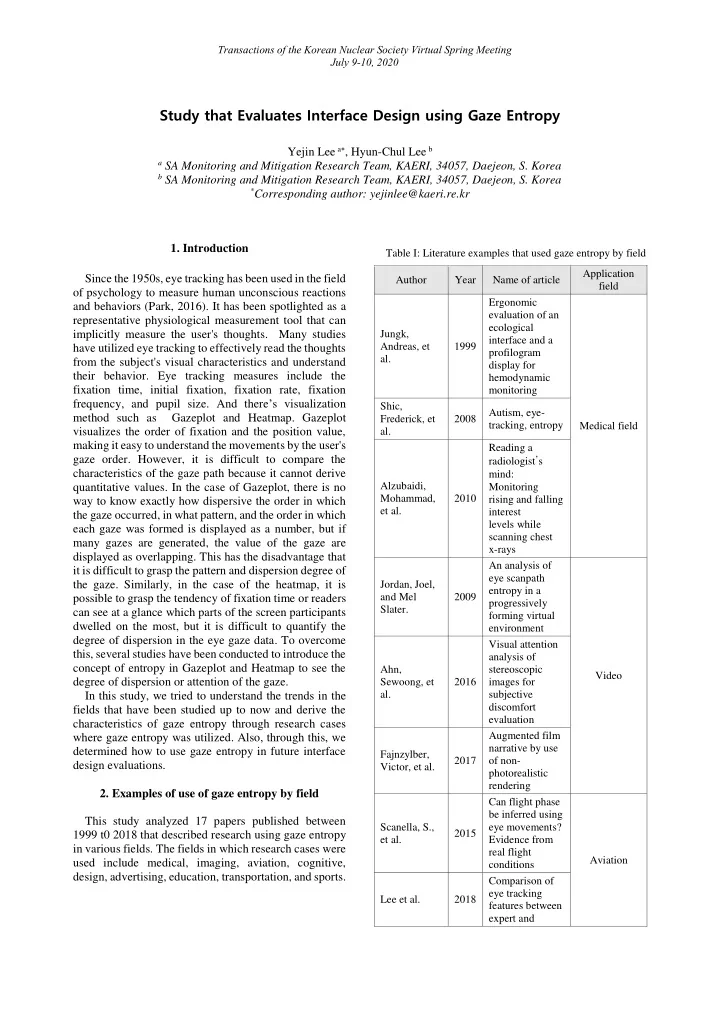
This study analyzed 17 papers published between 1999 t0 2018 that described research using gaze entropy in various fields. The fields in which research cases were used include medical, imaging, aviation, cognitive, design, advertising, education, transportation, and sports.

Table I: Literature examples that used gaze entropy by field Author Year Name of article Application field Jungk, Andreas, et al. 1999 Ergonomic evaluation of an ecological interface and a profilogram display for hemodynamic monitoring Medical field Shic, Frederick, et al. 2008 Autism, eye- tracking, entropy Alzubaidi, Mohammad, et al. 2010 Reading a radiologist’s mind: Monitoring rising and falling interest levels while scanning chest x-rays Jordan, Joel, and Mel Slater. 2009 An analysis of eye scanpath entropy in a progressively forming virtual environment Video Ahn, Sewoong, et al. 2016 Visual attention analysis of stereoscopic images for subjective discomfort evaluation Fajnzylber, Victor, et al. 2017 Augmented film narrative by use

  • f non-

photorealistic rendering Scanella, S., et al. 2015 Can flight phase be inferred using eye movements? Evidence from real flight conditions Aviation Lee et al. 2018 Comparison of eye tracking features between expert and

slide-2
SLIDE 2

Transactions of the Korean Nuclear Society Virtual Spring Meeting July 9-10, 2020 novice pilots during Landing Raptis, George E., Christos A. Fidas, and Nikolaos M. Avouris. 2017 On implicit elicitation of cognitive strategies using gaze transition entropies in pattern recognition tasks User Recognition Ebeid, I. A., Bhattacharya, N., & Gwizdka, J. 2018 Evaluating the efficacy of real- time gaze transition entropy Krejtz, Krzysztof, et al. 2014 Entropy-based statistical analysis of eye movement transitions Bhavsar, P., Srinivasan, B., & Srinivasan, R. 2017 Quantifying situation awareness of control room

  • perators using

eye-gaze behavior Interface Design GU, Zhenyu, et al. 2018 Predicting webpage aesthetics with heatmap entropy Hooge, I. T., & Camps, G. 2013 Scan path entropy and arrow plots: Capturing scanning behavior of multiple

  • bservers

Advertising Chanijani, Seyyed Saleh Mozaffari, et al. 2016 Entropy based transition analysis of eye movement on physics representational competence Education Gotardi, Gisele, et al. 2018 The influence of anxiety on visual entropy of experienced drivers Transportation Ryu et al. 2018 Visual search strategies in badminton serve

  • n expertise

levels sports

  • 3. Analysis method and characteristics of gaze

entropy through research cases Through the 17 papers surveyed, it was found that Shannon entropy and Markov entropy were used to quantitatively measure Gazeplot. In addition, it was found that Shannon entropy using a Gaussian distribution was used to quantitatively measure the heatmap. The following analysis explored the quantitative measurement method that used the entropy

  • f the current Gazeplot and Heatmap and analyzed the

characteristics and limitations of the current analysis method. 3.1 Gazeplot quantification method and features using entropy Shannon Entropy is named after Claude Shannon, an American mathematician and engineering communication theorist who is also called the father of digital age. Shannon was the first to study how to transmit information such as text, sounds, and images through the binary method of 0 and 1. Here, entropy refers to the average amount of information, and information refers to knowledge that reduces uncertainty in an uncertain situation. The unit of information amount is defined as a bit (binary digit), and 1 bit is the amount

  • f information that we get when one of two alternatives

with the same feasibility is specified. Therefore, as the uncertainty increases, the average amount of information

  • increases. That is, if the probability of each alternative’s
  • ccurrence is the same, the entropy value becomes

maximum. If this is expressed as Shannon entropy for gaze tracking analysis, the probability of the alternative

  • ccurring is the probability that fixation occurs for each

AOI, which is expressed as the fixation count of each AOI / total AOI fixation count. This is expressed as equation (1): H = -∑ 𝑄

𝑗 𝑜 𝑗=1

𝑚𝑝𝑕2𝑄

𝑘

(1) Therefore, Shannon's entropy is not measured by the gaze movement pattern between the AOIs, but is calculated only by the probability of fixation count in

  • AOI. If it shows a high Shannon entropy, this means that

the user has given their visual attention evenly among the

  • AOIs. In addition, a low Shannon entropy value indicates

that the gaze is biased to a specific AOI (Krejtz et al., 2014). Krejtz et al. (2014) used Shannon Entropy to measure the degree of interest of a specific part (specific AOI) on the artwork. However, Shannon Entropy has the disadvantage that it cannot measure the gaze pattern. For example, Shannon Entropy does not reflect whether the movement

  • f the gaze moves in the order of 12121 or 21121 on the
  • AOI. To compensate for this, Markov entropy is used.

Markov Entropy that uses the Markov Chain has the

slide-3
SLIDE 3

Transactions of the Korean Nuclear Society Virtual Spring Meeting July 9-10, 2020

advantage of being able to calculate entropy based on the direction of the gaze (Shic at al., 2008). Markov entropy refers to entropy in which the probability assumption of the Markov chain model is applied to Shannon entropy. Here, the Markov chain is a probability assumption that statistically deals with the prediction of time series data. Time series can exist continuously or discretely, and it is called Markov chain if it is possible to represent {𝑌0,𝑌1, 𝑌2,…} with discrete values in a certain temporal

  • rder. Here, it is expressed as the state in time (state, X).

For example, when 𝑌𝑢 = 1 , it can be said that the value in the state at time t is 1(i). In addition, since the future state (𝑌𝑢 + 1) is assumed to be affected only by the current state (𝑌𝑢), the past state, starting from the present, does not affect the future state. This is expressed as Equation (2): (2) The set of state values defined above is called a state space (S), which means a space of state values, that is, a range of values (Equation 3): S = {𝑗0, 𝑗1, 𝑗2, 𝑗3, … , 𝑗𝑜} (3) After the state set is defined, the transition probability, which is the probability of moving between each state set, can be obtained. The transition matrix can be expressed by the following conditional expression with the probability (Pij) of moving from the state set i to the state set j. It means the probability of moving from the i-th state at time t to the j-th state at time t + 1. That is, 𝑌𝑢 represents the starting state point as the current point in time, and 𝑌𝑢 + 1 represents the point arriving from the future point 𝑌𝑢state, which is defined as Equation (4). For example, the transition matrix of three state sets {𝑇1, 𝑇2, 𝑇3} is as follows: 𝑄

𝑗𝑘 = 𝑄(𝑌𝑢+1 = j |𝑌𝑢 =1)

(4) 𝑌𝑢+1 𝑌𝑢 ( 𝑄

11

𝑄

12

𝑄

13

𝑄

21

𝑄

22

𝑄

23

𝑄

31

𝑄

32

𝑄

33

) In order to obtain the probability of a set of states at any arbitrary time state, it can be expressed by the initial state probability multiplied by the successive state transition probability (Eq. 5) ∑ 𝜌𝑗

𝑜 𝑗=1

= 1 (5) 𝜌𝑘 = ∑ 𝜌𝑘𝑄

𝑗𝑘 𝑗

If this is expressed as a Markov entropy for eye tracking analysis, the state combination is represented by each AOI. In addition, the initial probability is the number of each AOI's gaze / total gaze, which can indicate the initial probability for each AOI, and the transition probability is i. This can be represented by the probability of moving from the i-th AOI to the j-th AOI. It is expressed as Eq. (6) and is an example of Markov entropy. H = -∑ 𝑄

𝑗 𝑜 𝑗=1

∑ 𝑄

𝑗𝑘𝑚𝑝𝑕2𝑄 𝑗𝑘 𝑘≠1

(6) However, Markov entropy is a measure of the gaze complexity based on the order, and the probability of going from the initial state to the initial state itself is not

  • calculated. It also has the disadvantage that measurement

by time is impossible. That is, if the first AOI has a fixation visit for 1 second, and the second AOI has a fixation visit for 1 second, the gaze movement is measured to move 1-2, but the first AOI has a fixation visit for 2 seconds. If there is a fixation visit in the second AOI for 1 second, it is measured that there is a fixation visit in 1-2, not in 1-1-2. Hooge at al. (2013) treated AOIs that overlapped and appeared consecutively as one AOI (ABABCDT AOI was treated as ABCDT), and Guat al. (2018) treated this part as the same fixation visit. The probability of being in the AOI was treated as “0”, and it can be seen that the overlapping AOI was not calculated as entropy. In the future, this issue should be supplemented, and research should be conducted. On the other hand, when analyzing the Gazeplot entropy, it is important to pay attention to the number of

  • AOIs. Since the entropy value is affected by the number
  • f AOIs, the more AOIs there are, the greater the entropy.

Therefore, it is important to standardize (Krejtz at al., 2014). Gu at al. (2018) used relative entropy when comparing the number of AOIs or the size of AOIs. Relative entropy is a value obtained by dividing the generated entropy by the maximum entropy that can

  • ccur, which can be expressed by equation (7):

𝐼𝑠𝑓𝑚𝑏𝑢𝑗𝑤𝑓 =

𝐼 𝐼𝑛𝑏𝑦

(7) In addition, gaze entropy can be used to analyze whether there is a difference in gaze patterns between experts and

  • novices. In the previous studies, most of the experts’

cases read the necessary elements quickly, so most of them showed strategic gaze path values. Therefore, the expert showed a low gaze entropy, and the novice showed a high gaze entropy. Gaze entropy was also useful in comparing eye pattern analysis for interface

  • design. The interface designed to be easy to understand

shows a lower entropy because it has a strategic gaze path. 3.2 Quantification method and features of visual attention entropy

slide-4
SLIDE 4

Transactions of the Korean Nuclear Society Virtual Spring Meeting July 9-10, 2020

Heatmap entropy can be measured using a Gaussian

  • distribution. If the pixels on the screen have a resolution
  • f 1280 * 800, a combination of 1280 X and 800 Y

coordinates can be created. Assuming that the gaze stays at a specific pixel, the Gaussian distribution of the gaze is represented by Equation (8) below, which represents the continuous probability of the gaze formed in the heatmap. (8) Here, the standard deviation refers to the degree of scattering for the distribution. In eye tracking, the standard deviation means the visual angle and the minimum range of pixels that the user can perceive when viewing the screen. It has a value of 50px according to Liu et al. (2010). If multiple Heatmap Gaussian distributions are formed on a single screen, it is necessary to express them as one continuous probability distribution by weighing the distributions. The weight of each distribution was expressed as a fixation duration (d) according to the study of Guet al.(2018), which is shown in Eq. (8). (9) When each successive probability obtained in this way was applied to the equation of Shannon entropy, it is represented by equation (9). (10) Heatmap entropy was unable to obtain information on the order of gazes, but was suitable for measuring interest. In a study by Gu et al. (2018), when Gazeplot entropy was used to quantitatively measure aesthetics on a web page, there was no correlation between Gazeplot entropy and aesthetics, but a high correlation was found when using heat entropy. Moreover, Krejtz et al. (2014) showed a higher heatmap entropy as the preference for a particular artwork was higher. It seems that the reason why heatmap entropy is more suitable for measuring the degree of interest than Gazeplot entropy is that it is a time-based measurement method.

  • 4. Conclusions

In this study, we investigated the research methods that used gaze entropy for the quantification methods of Gazeplot and Heatmap, which are gaze measurement visualization indicators in various fields. Through this, the current research trends and gaze entropy characteristics were found. Studies using gaze entropy have been conducted in various fields such as medical, imaging, aviation, cognition, design, advertising, education, transportation, and sports. Through this, it was confirmed that Gazeplot is used as Markov entropy and Shannon entropy. In addition, a method for standardizing the number of AOIs in Gazeplot was

  • considered. From previous studies, it was found that gaze

entropy is useful for evaluating differences in gaze characteristics or effectiveness of the interface between skilled and unskilled people. This will be very useful for the user's gaze characteristic evaluation and interface design evaluation in the future. Also, in the case of heatmap entropy, it was found that it is possible to calculate the degree of gaze dispersion on the screen in

  • rder to consider the fixation duration using a Gaussian
  • distribution. It can be seen that gaze entropy should be

interpreted and applied differently according to the direction of future research, considering that the fixation time is not considered, but only entropy considering

  • rder. Also, when measuring the degree of interest, it is

appropriate to use the heatmap entropy because the consideration of fixation time should be given priority rather than the order. The results of this study will be used as basic data for the use of gaze entropy in interface design evaluation. REFERENCES

[1] CHANIJANI, Seyyed Saleh Mozaffari, et al. Entropy based transition analysis

  • f

eye movement

  • n

physics representational competence. In: Proceedings of the 2016 ACM International Joint Conference on Pervasive and Ubiquitous Computing: Adjunct. 2016. p. 1027-1034 [2] GU, Zhenyu, et al. Predicting webpage aesthetics with heatmap entropy. arXiv preprint arXiv:1803.01537, 2018. [3] HOOGE, Ignace TC; CAMPS, Guido. Scan path entropy and arrow plots: Capturing scanning behavior of multiple

  • bservers. Frontiers in Psychology, 2013, 4: 996.

[4] KREJTZ, Krzysztof, et al. Entropy-based statistical analysis

  • f eye movement transitions. In: Proceedings of the

Symposium on Eye Tracking Research and Applications. ACM,

  • 2014. p. 159-166.

[5] LIU, Yang; CORMACK, Lawrence K.; BOVIK, Alan C. Dichotomy between luminance and disparity features at binocular fixations. Journal of vision, 2010, 10.12: 23-23. [6] Park, H. K., A Study on Evaluating Visual Attention of Public Environment Facilities in Subways by Using Eye tracking Method, Archives of Design Research, 23(1), 238-247, 2010. [7] SHIC, Frederick, et al. Autism, eye-tracking, entropy. In: 2008 7th IEEE International Conference on Development and Learning. IEEE, 2008. p. 73-78.