
SLIDE 1
L
- yalist T
- wnship
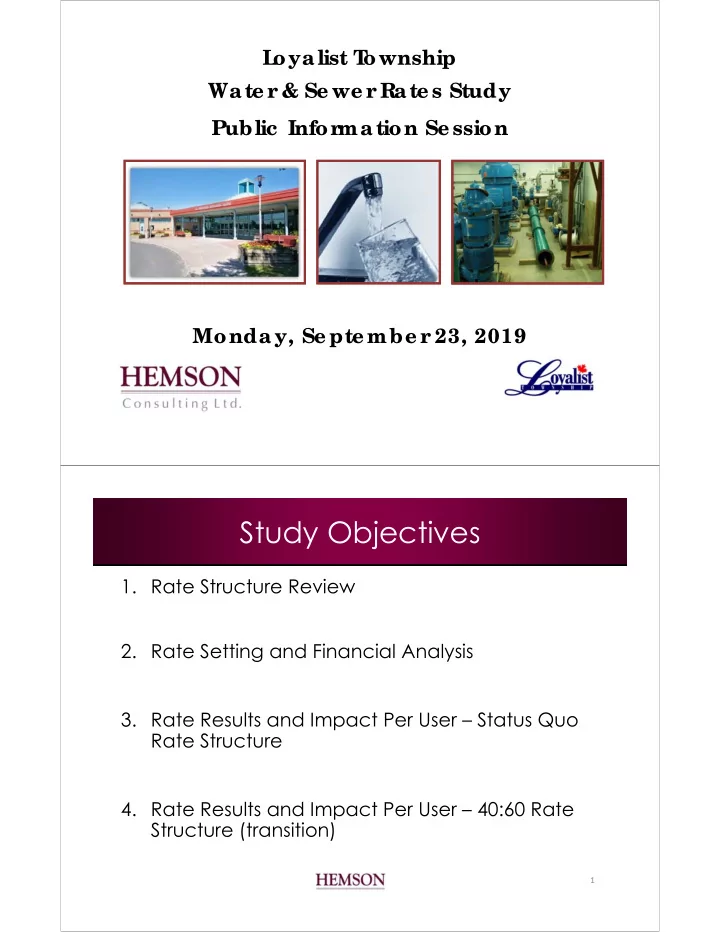
Wate r & Se we r Rate s Study Public Infor mation Se ssion Monday, Se pte mbe r 23, 2019
Study Objectives
- 1. Rate Structure Review
- 2. Rate Setting and Financial Analysis
- 3. Rate Results and Impact Per User – Status Quo
Rate Structure
- 4. Rate Results and Impact Per User – 40:60 Rate
Structure (transition)
1