
SLIDE 1
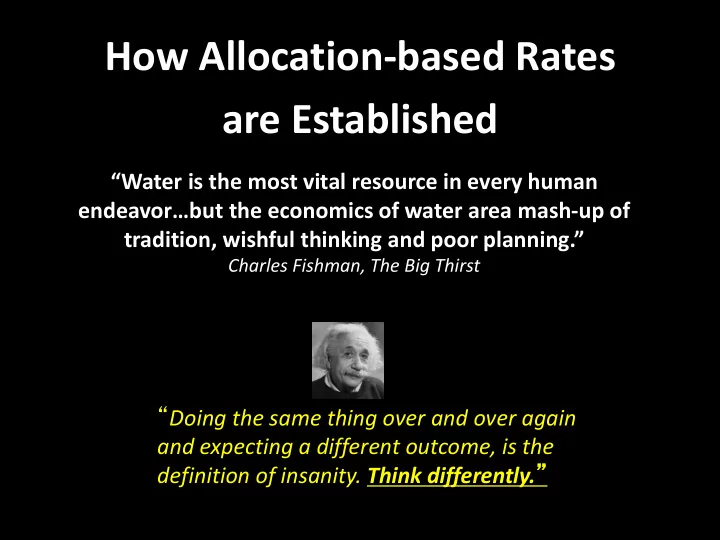
How Allocation-based Rates are Established
“Water is the most vital resource in every human endeavor…but the economics of water area mash-up of tradition, wishful thinking and poor planning.”
Charles Fishman, The Big Thirst
How Allocation-based Rates are Established Water is the most vital - - PowerPoint PPT Presentation
How Allocation-based Rates are Established Water is the most vital resource in every human endeavorbut the economics of water area mash -up of tradition, wishful thinking and poor planning. Charles Fishman, The Big Thirst Doing the
Charles Fishman, The Big Thirst
“Sustainable” Rate Structure
Fixed Charge/ System Cost
Variable Charge/ Water Cost Fixed Charge/ System Cost
Variable Charge
Variable Charge/ Water Cost
(Reality + State Standard) + (Science + Reality + State Standard + Logic) = Win/Win
study
square footage data
review/upgrade
10.Stakeholder outreach 11.Testing the “system”
(regardless of weather, water use, drought, economy)
reduction
efficiency programs
20 40 60 80 100
IRWD’s water allocation process is fair
I understand the rate structure
85%
85 %
85%
The water allocation process is fair
I understand
the IRWD’s rate structure
Residential GPCD
leaks and water waste.” PWD
where we estimated even with significant water savings.” RCWD
water efficiency standards.” MNWD
Satisfaction.” IRWD
new rate structure implementation within 6 months.”WMWD
WBR Implementations:
SOTWI, 2014)
(AWWA SOTWI, 2014)
“Change” itself is “Hard”
(Customers unhappy w/ fixed tiers)
Spread more Fixed costs across 3 Tiers creating Higher priced water (tiers)
balance the budget since 2010 (Customers unhappy w/ fixed tiers) Why?
charge
(variable charge)
to economy and drought
Source: 2006 City Rate Study
11
“I just had the most amazing phone call. This customer called quite upset, armed with plenty of misconceptions about the water industry that he was ready to attack me with. I was able to counter all his points in a kind but brutally honest way. It was awesome! Wish more people would call with hard questions about water and the industry.” (5/2/14) Gregory Bucy, Customer Service Rep 1, WMWD
recovery
achieves the various agency goals with the least financial risk to the agency
Predictable Failure of Rate Design “We see nothing in Article XIII, section 6, subdivision (b) (3) of the California Constitution that is incompatible with water agencies passing on the true cost of water to those consumers whose extra use of water forces water agencies to incur higher costs to supply that extra water.” Court of Appeal – 4th District, April 20, 2015
4/10/14 5/09/14 1255 1337 82 CCF
USAGE – INDOOR 16 1.48 $23.68 USAGE - OUTDOOR 23 2.64 $20.72 USAGE - INEFFICIENT 20 4.28 $85.60 USAGE - EXCESSIVE 19 8.56 $162.64 USAGE - ABUSIVE (UNSUSTAINABLE) 4 11.10 $44.40 WATER SERVICE CHARGE $23.90 SEWER SERVICE CHARGE $16.90 YOUR ALLOCATION FOR THIS BILL 39 CCF BILL CALCULATION BASED ON .12 ACRES $377.84