
SLIDE 1
Turners Falls Instream Flow Study Study Process Overview Study - - PowerPoint PPT Presentation
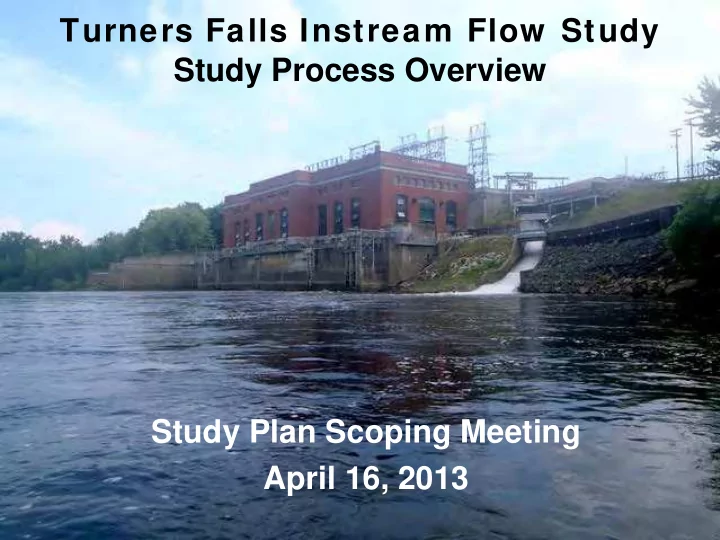
Turners Falls Instream Flow Study Study Process Overview Study Plan Scoping Meeting April 16, 2013 Study Timing Relative to ILP schedule ILP Schedule Proposed Study Plans (PSP): 4/15/13 Study Plan Meeting: 5/14-15/13 Additional
ILP Schedule
Why Accelerate?
impacts on hydropower generation
Macrohabitat – water quality and hydrology Mesohabitat – commonly occurring habitat types Critical habitat – important to a species even if not common Microhabitat – depth, velocity and cover within each mesohabitat Weighted Usable Area - quantitative index of habitat suitability
1. Study Planning 2. Locate reaches and transects 3. Obtain channel profile and microhabitat data 4. Develop hydraulic model 5. Input suitability rating criteria
each flow increment of interest
1. Study Planning 2. Locate reaches and transects 3. Obtain channel profile and microhabitat data 4. Develop hydraulic model 5. Input suitability rating criteria
each flow increment of interest
Flow control downstream
Flow control downstream Repeating channel pattern: riffle/run/pool Unique channel condition:
cobble rapids
Minor tributary
Major tributary
Flow control downstream Spawning bar Juvenile and adult feeding and holding
Flow control downstream REACH 1 REACH 2
Flow control downstream REACH 1 REACH 2 Critical reach study site
Representative reach study site
pool riffle run
Sand bar
pool riffle run
pool riffle run
pool riffle run T-1 T-2 T-3 T-4 T-5
1. Study Planning 2. Locate reaches and transects 3. Obtain channel profile and microhabitat data 4. Develop hydraulic model 5. Input suitability rating criteria
each flow increment of interest
Top of bank Toe of bank Edge of water Thalweg
headpin tailpin
Water surface
Top of bank Toe of bank Edge of water Thalweg
headpin tailpin
pool riffle T-1 T-2 T-3 T-4 T-5
COBBLE GRAVEL
un-imbedded highly imbedded
Abundant refuges Few refuges
1. Study Planning 2. Locate reaches and transects 3. Obtain channel profile and microhabitat data 4. Develop hydraulic model 5. Input suitability rating criteria
each flow increment of interest
High flow (WSL only) mid flow (WSL and velocities) low flow (WSL and some velocities)
100 cfs 1,800 cfs
1. Study Planning 2. Locate reaches and transects 3. Obtain channel profile and microhabitat data 4. Develop hydraulic model 5. Input suitability rating criteria
each flow increment of interest
Survey elevations bathymetry
Scenario “A” Scenario “B”
1. Study Planning 2. Locate reaches and transects 3. Obtain channel profile and microhabitat data 4. Develop hydraulic model 5. Input suitability rating criteria
each flow increment of interest
5000 10000 15000 20000 25000
100 200 300 400 500 600 Habitat Suitability (WUA) Discharge (cfs)
Pleasant River IFIM Study. Habitat and wetted area vs. flow relationship in mid-river (Reach No. 4) riffle run (Sq Ft per 1,000 ft of stream).
YOY Parr
Review hydrology time series Compare habitat under existing and alternate flow scenarios Compare project operation under existing and alternate flow scenarios Assess extent to which all objectives are met under each flow scenario Evaluate trade-offs Re-run alternative scenarios
– Define applicable bio-periods – develop flow duration data for each – Merge WUA/flow curve with flow duration curve – Look for alternatives that meet habitat and operation objectives
– Map spatial distribution of habitat “hotspots” at paired flows in GIS – Look for pair combinations that provide consistently good habitat – Develop matrix for species/lifestages – Iteratively look for scenarios that balance both operation and habitat
200 240 280 320 360 400 200 400 600 800 weighted usable area (SQ FT) discharge (CFS)
July - September habitat suitability
RBT adult
14000 16000 18000 20000 22000 10 20 30 40 50 60 70 80 90 100 Weighted Usable Area ft2/1000ft % of time streamflow was equaled or exceeded
Natural
14000 16000 18000 20000 22000 10 20 30 40 50 60 70 80 90 100 % of time streamflow was equaled or exceeded Weighted Usable Area ft2/1000ft Natural "worst case" current practice
14000 16000 18000 20000 22000 10 20 30 40 50 60 70 80 90 100 % of time streamflow was equaled or exceeded Weighted Usable Area ft2/1000ft Natural current practice Alternative "A" Alternative "B" Alternative "C"