
SLIDE 1
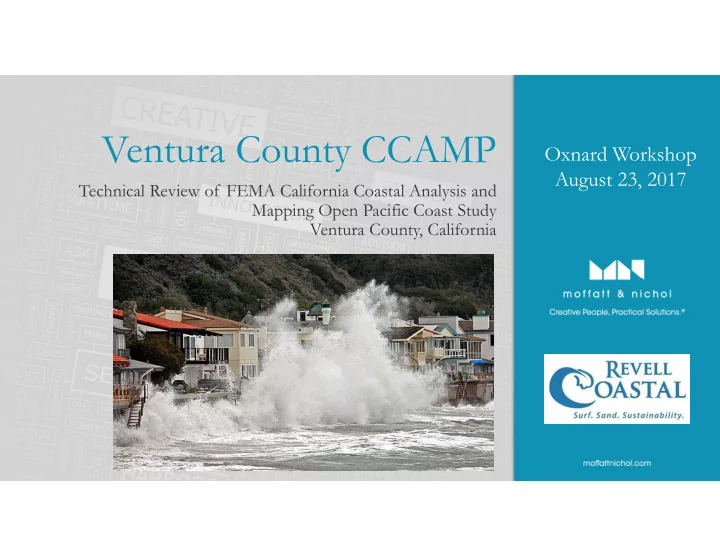
Ventura County CCAMP
Oxnard Workshop August 23, 2017
Technical Review of FEMA California Coastal Analysis and Mapping Open Pacific Coast Study Ventura County, California
Ventura County CCAMP Oxnard Workshop August 23, 2017 Technical - - PowerPoint PPT Presentation
Ventura County CCAMP Oxnard Workshop August 23, 2017 Technical Review of FEMA California Coastal Analysis and Mapping Open Pacific Coast Study Ventura County, California Technical Review Performed FEMA methodology Applicability of the
Technical Review of FEMA California Coastal Analysis and Mapping Open Pacific Coast Study Ventura County, California
PFIRM Panels 0882F 0884F 0903F 0911F
were not followed
between 46 and 47
was applied in the mapping for transects with overtopping.
MLWP = Most Likely Winter Profile Ru = the wave runup OT = overtopping OLP = overland wave propagation
Step 1 Step 2 Step 3 Step 4 Step 5
pattern was not reflected in the FEMA TWL data
changes in dredging
before the wave runup analyses
follow Pacific Guidelines.
was not calculated
than surrounding transects
varying periods between transects with no consideration
increase the BFE at these locations
PFIRM Transect No. Analysis Transect No. Effective BFE (FT, NAVD88) PFIRM BFE (FT,NAVD8 8) Extreme TWL(Over‐ /Under‐estimate/ Acceptable) Overtopping/ Overland Flow Record event (Date/Time) Peak Period (second)
45 383 13 19.4 U ‐ slope and waves seem low N 1/18/88 7:00 15.9 46 375 13 19.3 U ‐ slope and waves seem low N 1/18/88 8:00 14.4 47 359 13 20.1 U ‐ waves seem low N 1/18/88 8:00 14.4 48 347 13 20.6 U ‐ waves seem low Y 1/18/88 8:00 15.9 49 342 13 20.1 U ‐ waves seem low Y 1/18/88 8:00 15.9 50 338 13 21.3 A N 1/18/88 7:00 15.9 51 330 13 18.3 U ‐ waves seem low N 3/2/83 0:00 1/18/88 10:00 17.5 14.4 52 322 13 17.1 U ‐ waves seem low Y 3/2/83 0:00 1/18/88 8:00 17.5 11.9 53 308 16 10.8 O ‐ wave should be more sheltered Y (only 0.2%) 1/27/83 8:00 1/18/88 8:00 15.9 11.9
Note: U ‐ Underestimate A – Acceptable O ‐ Overestimate
Zone VE Coastal Hazard areas where waves and fast moving water can cause damage during the 1-percent-annual-chance flood, this includes:
wave runup elevation and where the runup height above the Stillwater elevation (SWEL) is greater than 3 feet.
waves could splash over the top of the beach/dune or top of a coastal structure.
splash over the top of the beach/dune or top of a coastal structure could be moving fast (≥ 200 ft3/sec2).
slope changes from steep to mild.
Zone AE Areas that could be inundated by the 1-percent-annual-chance flood. Many of these zones that were calculated are too small to be shown on the maps (width less than 35 feet) and are combined with zone VE). The criteria include:
Areas of shallow and slow moving floodwaters below the criteria for zone AE. Due to map scale limitations, many of these zones that were calculated are too small to be shown on the maps and are combined with zone AE or zone VE.