Studies of the Interactions of Nanoparticles with Lipid Bilayers - - PDF document

studies of the interactions of nanoparticles with lipid
SMART_READER_LITE
LIVE PREVIEW

Studies of the Interactions of Nanoparticles with Lipid Bilayers - - PDF document

Studies of the Interactions of Nanoparticles with Lipid Bilayers Using a Quartz Crystal Microbalance with Dissipation Monitoring (QCM-D) Samuel R. Howell Institut Laue-Langevin, EPN Campus, 71 Avenue des Martyrs, Grenoble CEDEX 9 - France


slide-1
SLIDE 1

Studies of the Interactions of Nanoparticles with Lipid Bilayers Using a Quartz Crystal Microbalance with Dissipation Monitoring (QCM-D)

Samuel R. Howell

Institut Laue-Langevin, EPN Campus, 71 Avenue des Martyrs, Grenoble CEDEX 9 - France Abstract Studies of lipid bilayers, and the effect of gold nanoparticles on them, were undertaken using a quartz-crystal microbalance with dissipation monitoring (QCM-D). These measurements aimed to determine whether DOPC and DOPC & cholesterol lipid bilayers had been formed on a quartz (SiO2) surface after injection and incubation. This was followed by injection of gold nanoparticles, and subsequent observation of their effect on the QCM-D output. A qualitative discussion on the effect of nanoparticles on the stability and properties of these bilayers follows based on our findings. In addition, the success of different vesicle preparation methods is discussed, with the aim of better informing future work using these bilayers. Key words: Lipid, QCM-D, Bilayer, Surface, Vesicle

1 Introduction The words ’lipid bilayer’ do not encapsulate the impor- tance of what they describe. At the beginning of this four week research project, the author of this report was, for lack of a better word, ignorant, as to the profound importance of lipid bilayers - and hence too the inher- ent value in studying them. One need not look far to see the importance of lipid bilayers - they are essential structures in biology, forming the framework of life’s fun- damental building block - the living cell[1]. The bound- ary of cells is important to numerous processes includ- ing the transport of species to and from a cell’s interior, biological mechanisms involving the body’s immune re- sponse and the effectiveness and toxicity of different drug molecules[2]. These boundaries are not just studied for scientific interest; it is crucial we understand lipid bilay- ers to advance our knowledge of human biology, medicine and the next generation of disease treatment. Such was the motivation of this study - to gain in- sight into a particular interaction which may have sig- nificant medical importance - the interaction of gold nanoparticles with a lipid bilayer[4]. For now it will suf- fice to say that gold nanoparticles have potential uses in cancer therapies due to their unique optical proper- ties (namely in theranostics)[5–9]. If these properties are to be fully utilised, however, one must assess the effect

  • f introducing them into the body. Drug development

has had catastrophic consequences in the past when un-

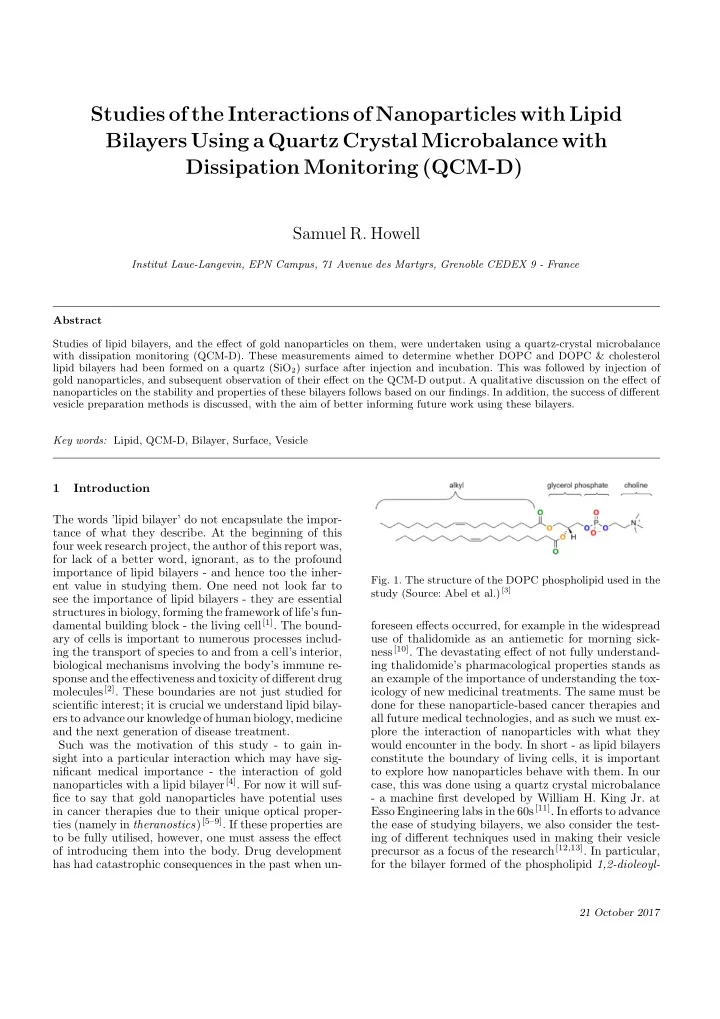
  • Fig. 1. The structure of the DOPC phospholipid used in the

study (Source: Abel et al.) [3]

foreseen effects occurred, for example in the widespread use of thalidomide as an antiemetic for morning sick- ness[10]. The devastating effect of not fully understand- ing thalidomide’s pharmacological properties stands as an example of the importance of understanding the tox- icology of new medicinal treatments. The same must be done for these nanoparticle-based cancer therapies and all future medical technologies, and as such we must ex- plore the interaction of nanoparticles with what they would encounter in the body. In short - as lipid bilayers constitute the boundary of living cells, it is important to explore how nanoparticles behave with them. In our case, this was done using a quartz crystal microbalance

  • a machine first developed by William H. King Jr. at

Esso Engineering labs in the 60s[11]. In efforts to advance the ease of studying bilayers, we also consider the test- ing of different techniques used in making their vesicle precursor as a focus of the research[12,13]. In particular, for the bilayer formed of the phospholipid 1,2-dioleoyl-

21 October 2017

slide-2
SLIDE 2
  • Fig. 2. The structure of cholesterol (Source: Atkins Physical

Chemistry) [14].

sn-glycero-3-phosphocholine, which shall here on be re- ferred to by it’s acronym, DOPC. Bilayer production in- volves several steps: first making a solution of lipid at the desired concentration, filtering vesicles by size and perhaps incorporating other molecules into the result- ing vesicle structures as well. The only bilayers studied here were those consisting of pure DOPC (See Figure ) and a DOPC & cholesterol mix (Figure 2). The motive

  • f this, as well as more fruitful detail of our studies, are

expanded in the next section. 2 Theory 2.1 Phospholipids Lipids are given the following definition in biochemistry: “any of a large group of organic compounds that are esters of fatty acids (simple lipids, such as fats and waxes) or closely related substances (compound lipids, such as phospholipids): usually insoluble in water but soluble in alcohol and other organic solvents[15]” A perfectly apt definition, for those familiar with chem-

  • istry. A more general description of lipids would be

that they are molecules consisting of two parts - a hy- drophilic, water-hating tail segment, and a hydrophilic, water-loving head group. This general amphiphilic[16] structure is made clearer in Figure 3, which shows the space-filling model of the phospholipid DPPC. Phos- pholipids, such as DPPC, are an abundant form of lipid, with a phosphate (PO4

–) in the head group.

These phospholipids, first discovered in 1847 by French chemist Theodore Nicolas Gobley[17], are extremely im- portant in biology, as the bilayer structure they adopt forms the boundary of living cells[18–20]. 2.2 Lipid Bilayers Lipids can form different structures, with the exact shape and size depending on various properties - such as the concentration and shape of the lipid monomer units[1]. The structure of interest to us is called the lipid

  • Fig. 3. The space-filling structure of the phospholipid DPPC

(Source: Nelson, Biological Physics) [21].

  • Fig. 4. Diagram showing the structure of a generic phospho-

lipid bilayer (Source: Nelson, Biological Physics) [21].

bilayer, and consists of two layers of lipids, as the name

  • suggests. These layers are oriented such that the tails
  • f the lipids are contained in the interior of the layer,

with the hydrophilic heads forming the outer boundary in contact with the solvent. There is minimal solvent contained within the boundary interior, where the tails

  • reside. A diagram of a lipid bilayer is shown in Figure
  • 4. One must remember when looking at these diagrams

however that the structure is not rigid - the phospho- lipid molecules will be in a state of complex, random thermal agitation at any time. So why exactly do these bilayers form? The reason is rooted in thermodynamics - and the argument behind it is particularly strong for dual-tailed phospholipids such as DOPC, although it also applies to single tailed

  • molecules. Essentially, when water molecules come into

contact with the hydrophobic tail(s) of a lipid, they as- sume an ordered structure around the tail to minimise the number of water molecules interacting with the tail. This is an attempt to minimise the interaction energy between the tail and water, and is known as the hy- drophobic effect - the ’cage’ the water molecules form around the tails is known as a solvation cage [2]. How- ever, from an energetic and entropic point of view, this is quite thermodynamically costly - the water molecules in this solvation cage form less hydrogen bonds than their bulk counterparts, and are thus in a compara- tively high energy state. They are also less disordered than molecules in the bulk, so a loss of entropy is as- 2

slide-3
SLIDE 3
  • Fig. 5. Diagram showing the cross-sectional structure of a

vesicle with a bilayer boundary (Source: Encyclopaedia Bri- tannica) [25].

sociated with this cage formation[2]. In an attempt to minimise these thermodynamically unfavourable inter- actions, the lipid molecules come together to align their tails and heads in the vicinity of one another - hence minimising any unfavourable interactions between their respective parts and with the solvent. Depending on the shape of the lipid monomers (units), this process leads to the formation of larger, ordered structures of various shapes, with a hydrophobic interior and outward-facing hydrophilic heads as mentioned earlier[22]. The concen- tration of the lipids required for this to happen must also be considered. Previous work has shown that a threshold concentration exists for the formation of these structures - called the ‘critical micelle concentration’ (CMC)[23,24]. This is more important when consider- ing single-tailed lipids, as the energetic cost of having two tails exposed to solvent, as in our bi-tailed DOPC, results in a very low CMC. This is because it is more favourable to form bilayers at low concentrations of lipid than to have two tails per molecule interacting with the

  • solvent. The shape of the bilayer structure which DOPC

forms is called a vesicle[16] (or liposome), and is shown in Figure 5. Figure 5 shows a structure known as a uni-lamellar vesicle (UV). This indicates that the boundary consists

  • f only one bilayer - but in fact, vesicles can exist with

numerous bilayers incorporated into the boundary[1]. These are called multi-lamellar vesicles, or MLVs. MLVs are what initially form when lipid molecules come to- gether as a vesicle[26], but for our purposes, they are not as useful as uni-lamellar vesicles. To achieve a sup- ported, uni-lamellar bilayer on a quartz surface which can be studied using QCM-D, it is favourable to have small, uni-lamellar vesicles (SUVs) beforehand. This was the motivation for the testing of different prepa- ration techniques - the success of forming a bilayer on a quartz surface is increased if SUVs are used, as they can fuse together more easily to form a larger surface bilayer[27]. For this reason, the following techniques of SUV preparation were tested:

  • Tip sonication
  • Extrusion
  • Freeze-thaw and extrusion

These techniques seek to disrupt the structure of mul- tilamellar vesicles and increase the content of SUVs in a solution. Details of the techniques are briefly explored in the following subsections. 2.3 Sonication Sonication is used for many different applications, in- cluding cleaning equipment[28], creating dispersions of nanoparticles[29] and disrupting biological mixtures[30], such as those containing the aforementioned MLVs. It utilises ultrasound waves to agitate whatever medium it is passed through, and is administered through a small metal tip. In our case, said tip was partly submerged in the vesicle solution of interest, and 5 second pulses

  • f ultrasound were passed through it over a period of

3 minutes. This was done immediately before the vesi- cle solution was studied using the QCM-D, so as not to leave enough time for the effects of the agitation to be reversed. 2.4 Extrusion Extrusion was another one of the techniques employed to produce SUVs. This technique can be summarised as passing a lipid solution through a porous filter un- der high pressure, so as to remove any vesicles above a threshold size and encourage the disruption of MLVs[31]. The apparatus used to do this is a metal chamber con- taining the porous filter paper bordered by polyethylene supports, which are penetrated at both ends by glass

  • syringes. One of these syringes is filled with the vesicle

mixture, and it is pushed from this syringe to the other multiple times through the paper filter. The filters used for the first extrusion were of pore size 200 nm, and this was followed by another extrusion with a 100 nm filter

  • for both filters the solution was passed to the opposite

syringe and back to the original 10 times. A picture of the extrusion apparatus is shown in Figure 6. 2.5 Freeze-thaw & extrusion The final technique we explored combined the aforemen- tioned extrusion technique with another called freeze-

  • thaw. This involves taking the initial vesicle mixture,

freezing it in a small plastic capsule using liquid nitro- gen for a few seconds, melting it by raising it’s temper- ature to 37oC in a dry bath, and repeating this proce- dure a number of times. This technique was employed 3

slide-4
SLIDE 4
  • Fig. 6. The extrusion apparatus used to filter out vesicles

above a threshold size (Source: Avanti Polar Lipids) [32].

  • Fig. 7. A photograph of the equipment used to perform the

freeze-thaw cycles and extrusion, showing the dry bath (blue box), liquid nitrogen container (silver cylinder) and extruder.

exclusively to the bilayers formed from a mixture of DOPC and cholesterol. Cholesterol and phospholipids are the two most abundant species found in the mem- branes of living cells[33], and freeze-thaw is useful in preparing vesicles which incorporate cholesterol into the structure[34]. This is because it increases the uptake of cholesterol into the DOPC vesicles[35], as well as altering the size and lamellarity of the vesicles to a distribution

  • f smaller, mostly unilamellar structures[26]. The freeze-

thaw technique was repeated 5 times, then followed by 10 repeated extrusions using both the 200 and 100 nm filters mentioned in the last section. A picture of the ap- paratus for freeze-thaw cycles is shown in Figure 7. Now the techniques used for preparing the vesicles have been detailed, we move on to the machine used to study the bilayers - the QCM-D. 2.6 Quartz Crystal Microbalance with Dissipation Monitoring (QCM-D) The QCM-D was used to analyse the mass adsorbed onto a silicon dioxide (quartz) crystal surface, as well as ob- tain some viscoelastic information on the surface bilayer in the form of a dissipation constant D. The machine consists of a few different parts, shown in Figures 8 and

  • 9. The QCM-D is essentially a sensitive gravimetric bal-

ance, detecting small changes in mass through a shift in the resonance frequency of a quartz crystal. Quartz (SiO2) crystal is used in the machine due to it’s clear resonant frequency, which can be measured with high

  • accuracy. When a mass is adsorbed onto the quartz sur-

face, this resonant frequency experiences a shift given by the Sauerbrey equation[36]: ∆f1 = −2nf 2 √ρqµq .∆m A (1) where

  • ∆f1 is the change in frequency
  • f0 is the resonant frequency
  • ρq is the density of quartz
  • µq is the shear modulus of quartz
  • A is the ’piezoelectrically active’ crystal area
  • ∆m is the change in mass

Ignoring the parameters not including frequency shift and change in mass, we see the following relationship is generally described by the simplified relation: ∆f1 ∝ −∆m that is to say, an increase in adsorbed mass leads to a decrease in the resonant frequency. When Sauerbrey de- rived Equation 1 in his paper[36], he did so under the assumption that any adsorbed layer is treated as an ex- tension to the quartz crystal and that, crucially, it is in

  • air. However, in order to model systems where an ad-

sorbed bilayer is surrounded by liquid - as would be the case for a decent model membrane - a correction[37] to the frequency shift needs to be made. Specifically, ∆f2 = −f 3/2 ( ηlρl πρqµq ) (2) where ηl is the viscosity of the liquid and ρl is it’s density, such that the total frequency change is given by ∆f = ∆f1 + ∆f2 (3) The change in resonant frequency of the quartz crystal upon a change in mass is rather more sensitive than the change in mass required to observe it - changes in mass

  • f a few nanograms are sufficient to see a frequency shift
  • f Hertz order. It is the measurement of that frequency

shift that allows the calculation of ∆m. The Sauerbrey equation (1) and correction for liquid media also only hold if the bilayer on the surface is rigid and uniform,

  • however. If this is not the case, then a different Sauerbrey

equation must be used for non-rigid bilayers. This is the reason for measuring the dissipation constant, D. The dissipation constant indicates to us whether or not the bilayer is rigid by measuring the energy loss per period

  • f oscillation of the bilayer. If energy is being lost by the

bilayer when excited at the resonant frequency of the quartz crystal, this implies that the oscillations of the 4

slide-5
SLIDE 5
  • Fig. 8. Photograph showing the QCM-D electronics box.

The machine used was a QSense E4 instrument consisting of an electronics box and chamber platform, with an attached pump.

  • Fig. 9. Photograph showing the QCM-D chamber platform

and attached pump. This was used for mounting the individ- ual quartz disks and flowing liquid through their mounting blocks.

crystal and bilayer are not coupled. In such an instance, the assumption that the bilayer is a rigid extension of the crystal, i.e. the assumption made by the original Sauerbrey equation, becomes invalid. D = Elost 2πEstored (4) Another way to think of the dissipation constant follows. Imagine one initiates an oscillation in the quartz crys- tal at it’s resonant frequency, then suddenly the driving potential of the oscillation is switched off. The ampli- tude of the resonant oscillation will decay, and the time constant of that decay can be related to the dissipation

  • constant. The dissipation constant D is also related to

the quality factor Q of the resonance peak of the crystal, specifically: D = f0 ∆f1/2 = 1 Q (5) where f0 is the resonant frequency of the crystal and ∆f1/2 is the width of the resonance peak at half height

  • sometimes referred to as the bandwidth of the peak.

What physically occurs when we use the QCM-D for measurements? The first step after obtaining a stable baseline with the instrument (see experimental section for details) is to inject the solution of SUVs prepared by one of the aforementioned techniques. This solution is left to incubate in the presence of the quartz surface, where one hopes the vesicles adsorb onto the surface, fuse, and form a uniform, rigid bilayer on the surface

  • f the crystal. The excess vesicles are then washed from

the chamber, leaving the adsorbed bilayer on the sur-

  • face. The next step is the injection of the nanoparti-

cles of choice - in our case, gold nanoparticles. The fre- quency shift and dissipation constant are monitored to give information about the effect of the nanoparticles on the lipid bilayer. One could observe perhaps a change in the frequency shift, or the dissipation constant, or both, which provides information on the characteristics

  • f the bilayer once nanoparticles are added (which are

discussed in the results section). What cannot be gained from QCM-D measurements are mechanistic certainties. For example, an increase in the adsorbed mass (seen as a decreasing shift in frequency via Equation 2.6) could not be attributed to nanoparticles penetrating the bi- layer structure with any more certainty than say, simply adsorbing to the bilayer surface. Answering such ques- tions would require the use of other techniques, such as quasi-elastic neutron scattering[38] or atomic force mi- croscopy[39], but this is suggested for future work and not discussed here in detail. 3 Experimental 3.1 Lipid Solution Preparation Solution used were (by mass):

  • 95:5% DOPC to Cholesterol
  • 100% DOPC

The solutions were prepared in these ratios to give an

  • verall volume of ∼2.5 cm3 and a combined concentra-

tion by mass of 2.5 mg/ml. Solutions were prepared by taking appropriate amounts of DOPC (chloroform sus- pended) and cholesterol (EtOH suspended) in a 7ml glass vial, dehydrating the mixture using Ar gas and re- dispersing it in phosphate-buffered saline (PBS). 3.2 Cleaning Prior to QCM-D measurement, the components must be cleaned to ensure no contamination from dust or previ-

  • us lipid residues occurs. A cleaning process was used on

both the quartz disks (see Figure 10) and their mounting ‘blocks’ (see Figure 11). For the disks, this consisted of 5

slide-6
SLIDE 6
  • Fig. 10. Photograph showing the quartz disks which were

mounted in the QCM-D. As shown, the SiO2 crystal is bor- dered by gold electrodes. The disks must be handled deli- cately, making sure not to scratch the surface or damage the

  • structure. Defects can alter the resonance frequency of the

crystal [40].

a 30 minute soak in 2% Neutracon solution followed by drying with nitrogen gas, before being placed in a UV- Ozone lamp (Bioforce UV/Ozone ProcleanerTMPlus) for 10 minutes. The disks were then re-submerged in wa- ter from a MilliQ machine until the mounting process

  • ccurred. For the mounting ‘blocks’ the process was

slightly different. Initially the blocks were submerged in a beaker of the same 2% Neutracon solution and placed in an ultrasonic bath for 15 minutes. This was followed by a thorough rinse in MilliQ water and another 15 minutes in the ultrasonic bath, submerged this time in MilliQ water instead of Neutracon. After this both the clean blocks and disks were dried using nitrogen gas, mounted

  • n the chamber platform and connected to the fluid lines

ready for measurements. (Post-measurements) - if im- mediately using the QCM-D for another measurement without dismounting, a 5 minute flush of 0.5 ml/min

  • f EtOH is undertaken, followed by a flush with MilliQ

water at the same flow for another 5 minutes. The sys- tem is then flushed at the same flow for 5 minutes with a 2% Neutracon solution, and another 5 minutes at 0.5 ml/min of MilliQ water - whilst ramping the tempera- ture back down to 25oC for the next resonance frequency

  • scans. If, however, the machine is being dismounted, then

it is sufficient to flush at 0.5 ml/min with MilliQ water, then suspend both the blocks and disks in MilliQ water until the more thorough cleaning procedure is repeated. 3.3 Running QCM-D Measurements Following the solutions of lipids being prepared, with

  • ne of the three techniques described earlier employed

to encourage the formation of SUVs, the next stage was to run QCM-D measurements. The first stage of us- ing the QCM-D involves cleaning the components thor-

  • ughly, which was detailed in the aforementioned sub-
  • Fig. 11. Photograph showing the blocks used to mount the

quartz disks on the chamber platform. The quartz disk was mounted in one half of the block before the other half was screwed in place above. These are subsequently connected to the fluid lines, one drawing fluid in from the source and another running to the pump and a waste beaker.

  • section. Following the mounting process, and with a flow
  • f MilliQ water of 0.1 ml/min, the first measurement

done in QCM-D is that of the crystal resonance fre- quency f0 and dissipation constant D at room temper- ature, and across a number of harmonics. In our case those used were the 3rd, 5th, 7th, 9th, 11th & 13th har-

  • monics. The 1st harmonic is excluded as it is extremely

sensitive to noise and minor fluctuations, meaning the data it offers is extremely unreliable. The reason a num- ber of harmonics are used is for reproducibility and iden- tifying potential faults in the QCM-D instrument. For example, if one harmonic is behaving strangely but the

  • thers are consistent, it suggests that perhaps an issue

with the electronics is to blame. Once the resonant fre- quencies are measured at the different harmonics for all

  • f the mounted sensors, and deemed to be in-line with

the expected value, this is repeated at 37oC - to simu- late temperature conditions in the body’s interior. Fol- lowing these measurements, a baseline measurement is

  • commenced. The baseline measurement is to ensure that

there is no significant deviation (+/ − 1 Hz) in the fre- quency shift being measured, and this is observed over a period of ∼5 minutes. Once this is satisfied, lipids can be injected by stopping and re-initiating the pump. Around 0.5 ml of the vesicle solution is injected to ensure sat- uration of the system, and this is then left to incubate for ∼30 minutes. If a stable bilayer has formed (more on this in Results & Discussion) then the gold nanoparti- cles are injected. Following gold nanoparticle injection, the system is again left to stabilise and the results ob-

  • served. Once data is saved, the nanoparticle solution is

collected in a vial by re-directing the waste fluid lines from the pump - this is to allow them to be analysed us- ing dynamic light scattering (DLS). Once the particles are collected, the system is cleaned using one of the two post-measurement procedures outlined in the ’Cleaning’ subsection. 6

slide-7
SLIDE 7
  • Fig. 12. Plot showing the QCM-D output against time for a DOPC & cholesterol solution prepared using the freeze-thaw and

extrusion technique. The frequency shifts at different harmonics are plotted in shades of blue, and the dissipation constant value D at different harmonics is plotted in shades of red. The scales for these parameters are on the left and right axes respectively.

4 Results & Discussion 4.1 Vesicle Preparation Techniques The first of the two main aims of the project was to es- tablish a reliable way of producing DOPC bilayers. Un- fortunately, due to the nature of DOPC, this is regarded as quite a difficult task. Of the three methods tested, it was found that utilising freeze-thaw cycles followed by extrusion proved the most successful. Due to the time- consuming nature of cleaning and taking measurements with a QCM-D machine, it is strongly suggested that more repeats of each method of vesicle preparation be undertaken in future to verify that one is, if shown, more reliable in lipid bilayer production. We explore the re- sults obtained during this project in the discussion that follows with this understanding firmly in mind. The effects of using freeze-thaw cycles on lipid solu- tions has been studied extensively before[13,31,35,41,42]. Cholesterol has an impact on the shape and distribu- tion of bilayers when it is incorporated into their struc- ture, in an effect known as the ‘cholesterol condensing effect’[33,43]. This condensing effect occurs when choles- terol molecules are inserted between phospholipids in the bilayer structure, and due to favourable interactions at- tributed to the hydrophobic effect[44], cause the bilayer to ‘condense’ into a more tightly packed structure[45]. It has been documented that the freeze-thawing tech- nique increases the uptake of cholesterol into DOPC vesi- cles[34]. We suggest that the reason for this creating suc- cessful bilayers in our case could be that the cholesterol molecules decrease the size of the vesicles when they are incorporated into it’s structure, resulting in more of the smaller SUVs that are favourable for bilayer formation due to their ease in fusing together. However, more work is needed in this area to provide conclusive evidence. An-

  • ther freeze-thaw & extrusion QCM-D measurement on

the same DOPC + cholesterol mix produced some ini- tial mass deposition on the surface of the quartz follow- ing vesicle injection. However, after flushing gently with 0.1 ml/min of MilliQ H2O, the frequency shift gradu- ally returned to a value of zero. This implies that what- ever deposited mass was adsorbed onto the surface was subsequently washed away. This may have been because vesicles adsorbed onto the surface, but did not fuse to create a bilayer[46], or that a bilayer formed but without complete surface coverage of the crystal surface. This has been reported in other work, which suggested that a ‘critical coverage’ of adsorbed vesicles is necessary to initiate bilayer formation[47]. Different techniques have been employed to study the surface coverage of lipid bi- layers, including atomic force microscopy (AFM)[48,49] and fluorescence microscopy[39,50,51]. It is also possible to measure the size distribution of vesicles in a solution using dynamic light scattering (DLS)[52,53]. We suggest 7

slide-8
SLIDE 8
  • Fig. 13. Picture showing some of the different ways a

nanoparticle might interact with the lipid bilayer (Source: Toledo-Fuentes et al.) [56]

that these techniques are used in future work to exam- ine more thoroughly the effect of these preparation tech- niques on the vesicle size distributions in solution, and the surface coverage of the adsorbed vesicles / bilayers they produce. 4.2 QCM-D Measurements In QCM-D data, such as that for the DOPC & choles- terol mix shown in Figure 12, we always expect a similar ‘shape’ to the plot if the system is behaving as we pre- dict[54]. The initial, settled baseline is visible first, fol- lowed by a sharp increase in the dissipation constant D and a large decrease in frequency shift ∆f, before the frequency shift rises again to a stable value and the dis- sipation constant decreases to a low, stable value also. This indicates that the surface of the quartz crystal in Figure 12, after stabilisation, has adsorbed mass (hence the negative ∆f) and that the bilayer which has formed is rigid (low value of D). Another key indicator of bilayer formation is the actual value of ∆f; a value of -25 Hz in- dicates bilayer formation[48], which is roughly what we

  • bserve in Figure 12 before nanoparticle injection. Fol-

lowing nanoparticle injection at around t = 32 minutes, we see a further decrease and plateau in the frequency shift and an increase and plateau in the value of D. The decrease in ∆f indicates a further mass uptake on the SiO2 surface, and the increase in the value of D indi- cates that the bilayer, or whatever structure is now on the surface, is less rigid than that before the nanopar- ticles were injected[55]. This could be due to a number

  • f different interactions of the nanoparticles with the bi-

layer - as mentioned earlier, it is impossible to say with certainty what is happening from QCM-D measurement

  • alone. Possibilities include the idea that nanoparticles

have adsorbed onto the surface of the bilayer, explaining the increase in adsorbed mass and decrease in rigidity. It could also be possible that the nanoparticles have pen- etrated the bilayer to reside on the surface themselves - an image of these situations is presented in Figure 13. Another one of the QCM-D measurements taken on tip sonicated DOPC showed slightly different results to those in Figure 12. This measurement is shown in Figure 14, and shows broadly the same features as Figure 12. In this plot however, we see that the lipid injection sta- bilised at a ∆f of roughly -30 Hz, which is a more nega- tive frequency shift than expected for a bilayer (around

  • 25 Hz). In addition, there is a large dissipation con-

stant at this frequency shift, implying that whatever is adsorbed onto the surface is not rigid - these two in com- bination may suggest that some vesicles had adsorbed

  • nto the surface, but not fused into a bilayer. This could

be because the vesicles are larger than the SUVs we had aimed to prepare, and thus do not fuse as successfully. When the nanoparticles were injected at t = 89 minutes, we again see a decrease in the frequency shift and in- crease in the dissipation constant D. However, the dissi- pation constant is a lot higher in value than in Figure 12. What this may suggest is that because the vesicles had adsorbed onto the bilayer without fusing well and were then washed away, the surface coverage of the bilayer is lower, and thus it is less rigid and results in a higher dis- sipation constant. However, we state unequivocally that more work in this area is required to reproduce and ex- plore these results. 5 Conclusions Work was undertaken to explore the preparation meth-

  • ds that best produce small unilamellar vesicles, with

the aim of creating supported DOPC & DOPC + choles- terol bilayers in a QCM-D machine with which to study the interaction they have with gold nanoparticles. The most successful of the three preparation techniques used was found to be freeze-thaw and extrusion, as the DOPC + cholesterol vesicles it produced formed a satisfactory bilayer on the quartz crystal surface of the QCM-D. Whilst the number of bilayers produced successfully was limited, the findings stand to inform future work using DOPC that will potentially save time in vesicle prepa-

  • ration. Studies of the bilayers using the QCM-D, and

specifically the effect of gold nanoparticles on these bi- layers, found that the presence of nanoparticles increases the mass adsorbed on the crystal surface, as well as decreasing the rigidity of the adsorbed structure. This could potentially suggest a few different interactions, and some simple possible scenarios were discussed here. It is recommended that future work in this area utilise

  • ther techniques to build a better picture of what in-

teractions are occurring between the nanoparticle and bilayer, with suggestions including AFM & quasi-elastic neutron scattering. DLS measurements on the vesicle size distribution after nanoparticle injection were under- way at the time of writing. Acknowledgements I would first like to warmly thank my supervisor, Lo¨ ıc Joly, for his support (and patience!) during my time working on the project. Secondly, I extend my thanks to the organisers of the summer school: Patrick Bruno, Laurence Tellier & Paul Steffens - all of whom made me feel very welcome during my month in Grenoble, and without their efforts I would not have been able to enjoy such a wonderful experience. Thank you sincerely for the time and dedication it took to make the summer school 8

slide-9
SLIDE 9
  • Fig. 14. Plot showing the QCM-D output for a tip sonicated DOPC vesicle solution. Note that in the legend, D 1:3 refers to

the value of the dissipation constant D measured by sensor 1, at the third harmonic.

  • possible. Finally, I would like to thank both the Euro-

pean Synchrotron Radiation Facility (ESRF) and Insti- tut Laue-Langevin (ILL) for the funding granted for my attendance; it is gratefully acknowledged. References [1]

  • E. Lutton, Journal of the American Oil Chemists

Society, 1972, 49, 1–9. [2]

  • B. Alberts, Molecular biology of the cell, New York

: Garland Science 2002, New York, 4th edn, 2002. [3]

  • S. Abel, N. Galamba, E. Karakas, M. Marchi,
  • W. H. Thompson and D. Laage, Langmuir, 2016,

32, 10610–10620. [4]

  • R. M. Anil and S. Roy, PLoS ONE, 9, e114152.

[5]

  • S. Jung, J. Park, S. Kim, J. Nam, S. Hwang, J. Hur,
  • K. Im and N. Park, Analytical Chemistry, 2013, 85,

7674–7681. [6]

  • K. C. Kwon, J. H. Ryu, J. Lee, E. J. Lee, I. C. Kwon,
  • K. Kim and J. Lee, Advanced Materials, 2014, 26,

6436–6441. [7]

  • Z. Wang, Science China Physics, Mechanics and

Astronomy, 2013, 56, 506–513. [8]

  • A. K. Rengan, A. B. Bukhari, A. Pradhan, R. Mal-

hotra, R. Banerjee, R. Srivastava and A. De, Nano Letters, 2015, 15, 842–848. [9]

  • V. Amendola, R. Pilot, M. Frasconi, O. M. Marag

and M. A. Iat, Journal of Physics: Condensed Mat- ter, 2017, 29, 203002. [10] M. E. Franks, G. R. Macpherson and W. D. Figg, The Lancet, 2004, 363, 1802–1811. [11] W. H. King Jr., Analytical Chemistry, 1964, 36, 1735–1739. [12] Y. P. Patil and S. Jadhav, Chemistry and physics

  • f lipids, 2014, 177, 8–18.

[13] Z. Huang, X. Li, T. Zhang, Y. Song, Z. She, J. Li and

  • Y. Deng, Asian Journal of Pharmaceutical Sciences,

2014, 9, 176–182. [14] P. W. P. Atkins, Atkins’ physical chemistry, Oxford : Oxford University Press, Oxford, 9th edn, 2010. [15] Dictionary.com Unabridged, 2017, http://www. dictionary.com/browse/lipid. [16] D. D. Lasic, The Biochemical journal, 1988, 256, 1. [17] J. T. Hensing, Bull. Hist. Chem, 2004, 29, 9. [18] A. Nath, W. M. Atkins and S. G. Sligar, Biochem- istry, 2007, 46, 2059. [19] N. A. Campbell, Biology / Neil A. Campbell ... et al.], San Francisco, Calif. ; London : Pearson/Ben- jamin Cummings, San Francisco, Calif. ; London, 8th edn, 2008. [20] D. L. D. L. Nelson, Lehninger principles of biochem- istry / David L. Nelson, Michael M. Cox, New York : W.H. Freeman, New York, 4th edn, 2005. 9

slide-10
SLIDE 10

[21] P. C. Nelson, Biological physics : energy, informa- tion, life / Philip Nelson, New York : W.H. Free- man, New York, Updated 1st ed.. edn, 2008. [22] V. Miyamoto and W. Stoeckenius, The Journal of membrane biology, 1971, 4, 252–269. [23] J. R. Henriksen, T. L. Andresen, L. N. Feldborg,

  • L. Duelund and J. H. Ipsen, Biophysical journal,

2010, 98, 2199–2205. [24] D. Marsh, CRC handbook of lipid bilayers, CRC Press, 1990. [25] Encyclopaedia Britannica

  • Image
  • f

Lipo- some, https://www.britannica.com/science/ liposome, Accessed: 18/10/2017. [26] L. D. Mayer, M. J. Hope, P. R. Cullis and A. S. Janoff, BBA - Biomembranes, 1985, 817, 193–196. [27] D. Papahadjopoulos, G. Poste, B. E. Schaeffer and

  • W. J. Vail, BBA - Biomembranes, 1974, 352, 10–28.

[28] S. Kumar, W. T. Lee and E. J. Szili, Journal of Hospital Infection, 2012, 81, 41–49. [29] S. Kawashima, J.-W. Seo, D. Corr, M. Hersam and

  • S. Shah, Materials and Structures, 2014, 47, 1011–

1023. [30] O. J. Llorin, M. C. Little, M. P. Collis and J. M. Har- ris, CELL DISRUPTION METHOD USING SON- ICATION, 2010, ID: TNeposCA2277467C. [31] S. G. M. Ong, M. Chitneni, K. S. Lee, L. C. Ming and K. H. Yuen, Pharmaceutics, 2016, 8, year. [32] Avanti Polar Lipids Inc. - Mini Extruder Pic- ture, https://avantilipids.com/divisions/ equipment/, Accessed: 18.10.2017. [33] M. Alwarawrah, J. Dai and J. Huang, The journal

  • f physical chemistry.B, 2010, 114, 7516.

[34] J. D. Castile and K. M. G. Taylor, International journal of pharmaceutics, 1999, 188, 87–95. [35] M. Trakia, D. E. Warschawski, M. Recouvreur,

  • J. Cartaud and P. F. Devaux, European Biophysics

Journal, 2000, 29, 184–195. [36] G. Sauerbrey, Zeitschrift f¨ ur Physik, 1959, 155, 206–222. [37] K. K. Kanazawa and J. G. Gordon, Analytical Chemistry, 1985, 57, 1770–1771. [38] E. Endress, H. Heller, H. Casalta, M. F. Brown and

  • T. M. Bayerl, Biochemistry, 2002, 41, 13078.

[39] M. Wong, J. Rujiviphat, G. Mcquibban and C. M. Yip, Biophysical journal, 2012, 102, 236A–236A. [40] F. L. Walls and J. R. Vig, Ultrasonics, Ferro- electrics and Frequency Control, IEEE Transactions

  • n, 1995, 42, 576–589.

[41] T. Kaasgaard, O. G. Mouritsen and K. Jrgensen, BBA - Biomembranes, 2003, 1615, 77–83. [42] L. Zhang, P. Li, D. Li, S. Guo and E. Wang, Lang- muir : the ACS journal of surfaces and colloids, 2008, 24, 3407. [43] J. Gallov, D. Uhrkov, A. Islamov, A. Kuklin and

  • P. Balgav, General physiology and biophysics, 2004,

23, 113. [44] M. Sugahara, M. Uragami, X. Yan and S. L. Regen, Journal of the American Chemical Society, 2001, 123, 7939–7940. [45] H. Cao, N. Tokutake and S. L. Regen, Journal of the American Chemical Society, 2003, 125, 16182. [46] L. K. Tamm and H. M. Mcconnell, Biophysical jour- nal, 1985, 47, 105–113. [47] E. Reimhult, F. Hk and B. Kasemo, Langmuir, 2003, 19, 1681–1691. [48] R. P. Richter and A. R. Brisson, Biophysical jour- nal, 2005, 88, 3422–3433. [49] R. Richter, A. Mukhopadhyay and A. Brisson, Bio- physical journal, 2003, 85, 3035–3047. [50] European Biophysics Journal With Biophysics Let- ters, 2005, 34, 710–710. [51] S. Das and P. Purkayastha, Langmuir : the ACS journal of surfaces and colloids, 2017, 33, 7281. [52] F. R. Hallett, J. Watton and P. Krygsman, Bio- physical journal, 1991, 59, 357–362. [53] J. Pencer and F. R. Hallett, Langmuir, 2003, 19, 7488–7497. [54] B. Ananthanarayanan, PhD thesis, University of California, Santa Barbara, 2009. [55] Q. Chen, S. Xu, Q. Liu, J. Masliyah and Z. Xu, Advances in Colloid and Interface Science, 2016, 233, 94–114. [56] X. Toledo-Fuentes, D. Lis and F. Cecchet, The Jour- nal of Physical Chemistry C, 2016, 120, 21399– 21409. 10