Molecular Modeling of Biomolecules: How can GPUs Advance Research? - - PowerPoint PPT Presentation

molecular modeling of biomolecules how can gpus advance
SMART_READER_LITE
LIVE PREVIEW

Molecular Modeling of Biomolecules: How can GPUs Advance Research? - - PowerPoint PPT Presentation

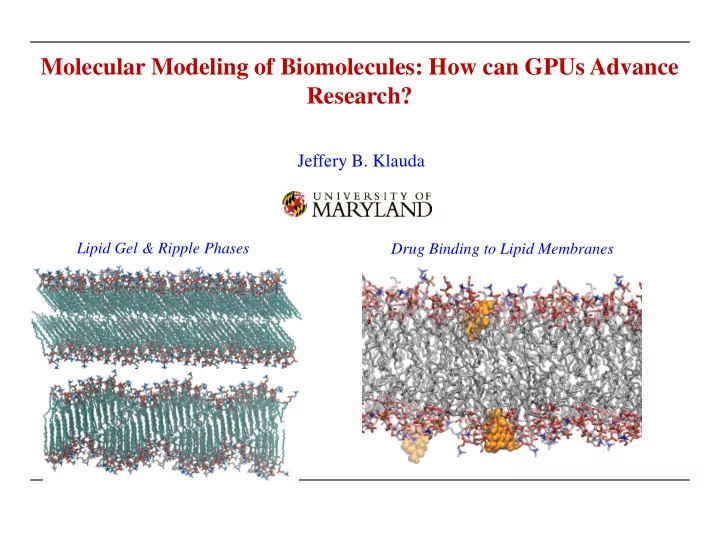
Molecular Modeling of Biomolecules: How can GPUs Advance Research? Jeffery B. Klauda Lipid Gel & Ripple Phases Drug Binding to Lipid Membranes Laboratory of Molecular & Thermodynamic Modeling Energy-based Research Hydrotrope


slide-1
SLIDE 1

Molecular Modeling of Biomolecules: How can GPUs Advance Research?

Jeffery B. Klauda

Drug Binding to Lipid Membranes Lipid Gel & Ripple Phases

slide-2
SLIDE 2

Laboratory of Molecular & Thermodynamic Modeling Energy-based Research Biomolecular/Membrane Research

DOE-Fossil Energy

Lipid Membranes Transmembrane Proteins Peripheral Proteins Geological Modeling of Hydrates CO2 Storage Hydrotrope Stabilizing nanodroplet of oil

slide-3
SLIDE 3

Research Methods & Design

 Research Design

ab initio QM Molecular Simulations & Models Macroscopic Properties

QM=Quantum Mechanics

System Size (# atoms) Time (real) QM

Electronic Structure

Molecular Sims (atomic)

Molecule-level phenomena fs ps ns µs ms s

LacY Rice Dwarf Virus Capsid

Mesoscale Simulations

Assembly-level phenomena 10 102 103 104 105 106 107

Lipid Bilayers

slide-4
SLIDE 4

Molecular Dynamics (MD)

 Governing Equations

i i i i i

r m a m f   = =

  • Newton’s Laws of Motion
  • Force drives the motion of a system

where i is a molecule or atom

ij ij ij

r w f  ∂ ∂ − =

where w is the inter- and intramolecular potential · Accurate force fields are required for realistic simulations

( )

              −       =

6 12

4 r r r w σ σ ε

Ar: σ=3.504 Å ε/k=117.7 K

Lennard-Jones Potential (van der Waals/non-bonded forces)

  • Why use MD?

· Probe biomolecules at atomic resolution without introduction of artificial labels or expensive equipment

· Aid experiments (diffraction, NMR, spin labeling) in determining what is measured1-4 · Dynamical understanding of membrane function

1Klauda et al. BJ. 90: 2796 (2006). 2Klauda et al. BJ. 94: 3074 (2008). 3Pendse, Brooks & Klauda. JMB. 404: 506 (2010). 4Rogaski & Klauda. JMB. 423: 847 (2012).

slide-5
SLIDE 5

Force Fields & System Sizes

 Biomolecular Force Field

· Many terms to describe intra- and intermolecular interactions

( ) ( )

( )

( ) ( )

( )

∑ ∑ ∑ ∑ ∑ ∑ ∑ ∑

+                 −         +       − + + − + − + − + − =

j i pairs nonbonded ij D j i j i pairs nonbonded ij ij ij ij ij dihedrals j j j j improper im cross UB angles bonds b

r q q r R r R n K K r r K K b b K R V

, , 6 min, 12 min, , UB 2 3 , 1 3 , 1 2 2

cos( 1 2 cos 1 ) ˆ ( ε ε δ ϕ φ θ θ

ϕ θ

· The r-12, r-6 and r-1 terms are the most computational demanding terms

 Typical System Sizes Required for Simulations Liquid Simulation (small molecule) Lipid Membrane (lipid only) Protein with Lipid Membrane Dimensions 8-10 nm3 125-700 nm3 500-1500 nm3 # atoms 3,000-5,000 20,000-70,000 50,000-150,000

  • Efficient codes that run these large systems is crucial
slide-6
SLIDE 6

MD Simulation Programs

 CHARMM (Chemistry at HARvard Macromolecular Mechanics)1  GROMACS (Groningen University)3

  • Came out of Prof. Martin Karplus’ group at Harvard
  • A comprehensive code that contains many cutting-edge techniques in

addition to traditional simulation techniques

 NAMD (Scalable Molecular Dynamics)2

  • NIH-supported code from Prof. Klaus Schulten’s group (UI-UC)
  • Less focus on functionality and more parallel scalability
  • GPUs & MICs: directly available in NAMD code
  • Development spawned from Prof. Herman Berendsen group
  • European analog to CHARMM
  • GPUs: Built-in functionality for GPUs

 Other Commonly Used Programs

  • AMBER, TINKER, DESMOD, and LAMMPS

1www.charmm.org 2www.ks.uiuc.edu/Research/namd/ 3www.gromacs.org

  • GPUs: CHARMM/OpenMM interface
slide-7
SLIDE 7

Computational Equipment/Resources

 Local UMD Computational Clusters (UMD/IT)  XSEDE (NSF Supported)

Stampede: Dell Linux cluster with 100,000+ Cores (10 PetaFlops) (All have MIC & some with GPUs) Deepthought: Dell Linux cluster with ~4000 cores Deepthought2: Dell Linux cluster with 9200 cores and 40 nodes with dual GPUs

K20

slide-8
SLIDE 8

Lipids

1Fahy et al. J. Lipid. Res. 46: 839 (2005).

 Complex biomolecules

  • Contain a fatty acid chains and head group

 Classified into 8 categories1

Modified (Fig. 1)1 Fatty acyls Glycerolphospholipids Sterol Lipids Saccharolipids Glycerolipids Sphingolipids Phenol lipids Polyketides

slide-9
SLIDE 9

Lipid Self-Assembly

 Self-assembly into phases depending on water content

  • Lower concentration of lipid form spherical micelles
  • Higher concentrations form bilayer structures (common in cells)

1S.A. Sefran. Statistical Thermodynamics of Surfaces, Interfaces and Membranes (Addison-Wesley, NY, 1994).

copied from ref 1

slide-10
SLIDE 10

Lipid Bilayer Phases

  • Fluid or liquid crystalline (Lα) bilayer

phases are most common and have high chain disorder.

  • Certain lipids go through a pretransition as

the temperature is lowered to a ripple phase with interdigitation.

  • This short pretransition (~10oC) leads to a
  • rdered gel phase (Lβ)
  • Introduction of cholesterol leads to a liquid
  • rdered phase (sometimes existing as a

lipid raft).

  • Can MD simulations on all-atom force

fields see this? Requires a significant amount of computational time.

1Eeman & Deleu. Biotechnol. Agron. Soc. Environ. 14: 719 (2010).

Figure 41

Phase Transitions

slide-11
SLIDE 11

MD Simulations of DMPC/DPPC Bilayers

 Details of the Simulation

  • Force field and composition: CHARMM361 and 50% DMPC
  • Program & #atoms: NAMD with 16,704
  • Deepthought2 with GPUs for 300ns of simulation time

1Klauda, J.B. et al. JPCB. 114: 7830 (2010).

 Benchmarks

#Cores hr/ns ns/day %Eff 20 1.99 12.1 40 1.06 22.7 94.0 60 0.74 32.4 89.7 80 0.63 38.4 79.6

  • Two K20m GPUs on a single node results in 1.24

hr/ns or 19.4 ns per day!

  • More significant speedup for larger systems

CPU-only DMPC/DPPC at 20oC

  • Two weeks to get 300ns with GPUs

and this took over two months on

  • lder generation HPC.
slide-12
SLIDE 12

Gel Phase DMPC/DPPC Bilayers Formation

50/50% of DMPC/DPPC at 20oC (300ns)

  • Starts with a Lα phase that shortly transitions to a ripple-like phase before gelling
  • Chain alignment and tilt between leaflets exists in agreement with experiment
slide-13
SLIDE 13

Ripple Phase DMPC/DPPC Bilayers Formation

25/75% of DMPC/DPPC at 25oC (300ns)

  • Starts with a Lα phase that slowly transitions to a ripple-like phase
  • Leaflet interdigitation and lipid buckling promotes the ripple-like phase.
slide-14
SLIDE 14

Drug Binding to Lipid Bilayers

 Drug Partitioning in Lipids

  • Many drugs and toxins are lipophilic that is they like lipids over water phases
  • Precursor to full transport into/out of cell via membrane transport proteins
  • Alternating Access Model of substrate transport with transmembrane proteins1

Periplasm Cytoplasm Periplasm Cytoplasm

S + S + + + + S S +

1Kaback et al. PNAS. 104: 491 (2007).

EmrE Efflux Protein

slide-15
SLIDE 15

MD Simulations of Ethidium Binding to a Lipid Bilayer

 Details of the Simulation

  • Force field and composition: CHARMM361 and POPC/POPG bilayer (simple bacterial

model)

  • Program & #atoms: NAMD with 30,000
  • Deepthought2 with GPUs for 200ns of simulation time

1Klauda, J.B. et al. JPCB. 114: 7830 (2010).

 Partitioning into Membrane

  • Benchmark: 18 ns per day with GPU+CPU
  • Quickly sample partitioning and dynamics of antibiotic binding to lipid membranes

with the use of GPU+CPU

0.012% Ethidium 0.047% Ethidium

slide-16
SLIDE 16

Movie of Ethidium Binding

  • Quickly determine the extent of drug binding to the membrane
  • Ethidium binds to the hydrophobic/philic interface but cannot easily go across the

bilayer without the aid of a transport protein

0.047% Ethidium in water with POPC/POPG Bilayer (200ns)

slide-17
SLIDE 17

Summary

Ethidium in BIlayer

  • MD simulations at the atomic level can probe a wide range of self-

assembly and biological problems

  • MD simulations require a high amount of computational resources

that benefit from GPUs

  • Most MD software has been optimized with CUDA programming
  • Lipid phase changes are complex but our use of CPU+GPU on

DT2 has allowed us to probe gel and ripple phase formation

  • Our C36 lipid force field1 accurately represents the phase transition

temperature of PC lipid mixtures

  • Many drugs and toxin partition into lipid membranes and fat cells
  • f the body
  • The use of GPU nodes has allowed us to quickly determine the

tendency of drugs to bind to membranes and their location

  • All of these projects are currently being applied to protein-related

research in drug transport and understanding of diseases

EmrE

1Klauda, J.B. et al. JPCB. 114: 7830 (2010).

slide-18
SLIDE 18

Brent Rogaski (M.S. 2010/Industry) Pushkar Pendse (Ph.D./Postdoc) Viviana Monje (Ph.D. Student) Pouyan Khakbaz (Ph.D. Student) Xiaohong Zhuang (Ph.D. Student) Joe Lim (undergrad/MIT) Diana Villanueva (undergrad/GSK) Chris Boughter (undergrad-phys) Sylvia Kang (undergrad-BioE) John Daristotle (undergrad) Sook Wong (undergrad) Ryan Konas (undergrad) Connor Welch (undergrad) Francis Bacarisas (undergrad-BioE)

  • Prof. Mikhail Anisimov (ChBE/IPST)
  • Dr. Ella Mihailescu (IBBR)

Acknowledgments

Outside University of Maryland

Richard Pastor (NIH/NHLBI) Rick Venable (NIH/NHLBI) Will Prinz (NIH/NIDDK) Klaus Gawrisch (NIH/NIAAA) Mary Roberts (Boston College) Wonpil Im (University of Kansas) Alex MacKerell (UMB) Katie Henzler-Wildman (WU-St. Luis) Bryan Berger (Lehigh U.) Hirsh Nanda (NIST) Yuji Sugita (Riken/Japan) Cor Peters (TU-Delft/Petroleum Institute)

University of Maryland Funding and Computational Resources

NSF CAREER (MCB-1149187) NSF/BIO (DBI-1145652) National Institutes of Health (intramural) Anton at NRBSC/PSC [PSCA00009P ] XSEDE [TG-MCB100139]/OIT (UMD)