
ASAKAWA ET AL.
- VOL. 6
’ NO. 10 ’ 9013–9020 ’ 2012
www.acsnano.org
9013
September 25, 2012
C 2012 American Chemical Society
Spatial Distribution of Lipid Headgroups and Water Molecules at Membrane/Water Interfaces Visualized by Three-Dimensional Scanning Force Microscopy
Hitoshi Asakawa,† Shunsuke Yoshioka,‡ Ken-ichi Nishimura,‡ and Takeshi Fukuma†,‡,*
†Bio-AFM Frontier Research Center and ‡Division of Electrical and Computer Engineering, Kanazawa University, Kanazawa, Japan
A
t the interface between a biological system and its surrounding physio- logical solution, water molecules in- teract with biomolecules constituting the
- surface. Through the interaction, water mol-
ecules have significant influence on the structure and function of biomolecules and their assembly.13 Therefore, under- standing the structure and function of a biological system requires investigations
- n the behavior of interfacial water. The
surface of a biological membrane mainly consists of hydrophilic lipid headgroups. So far, the membrane/water interface has been extensively studied by various techni- ques.411 These previous works have shown that the water molecules adjacent to a membrane strongly interact with the head- groups and have significant influence on its mechanical strength and fluidity.1214 How- ever, the molecular-scale origin for such a critical influence has remained elusive. One of the major difficultiesinsuchastudy lies in the measurement of molecular-scale structure of a membrane/water interface. As the lipid headgroups exhibit thermal fluctua- tions, the surface structure of a membrane is inherently ill-defined. In addition, the fluctu- ating lipid headgroups interact with mobile water, through which the interfacial water presents non-uniform density distribution known as hydration structure. Thus, the un- derstanding of the whole structure of the membrane/water interface should require a method to visualize three-dimensional (3D) distribution of mobile water as well as fluc- tuating lipid headgroups. Atomic force microscopy (AFM)15 has been widely used as a nanoscale surface imag- ing tool. In a typical AFM setup, a sharp tip is scanned in XY directions (i.e., parallel to the surface) on a sample to produce a two- dimensional (2D) image of the surface topo-
- graphy. In contrast, several methods have
recently been proposed for imaging 3D dis- tribution of forces acting on a tip (Ft) near the sample surface.1621 In these methods, a tip is scanned in Z direction (i.e., perpendicular to the surface) as well as in XY directions to image the whole 3D interfacial space. Among the proposed methods, 3D scanning force microscopy (3D-SFM)20 has the fastest
* Address correspondence to fukuma@staff.kanazawa-u.ac.jp. Received for review July 12, 2012 and accepted September 25, 2012. Published online 10.1021/nn303229j
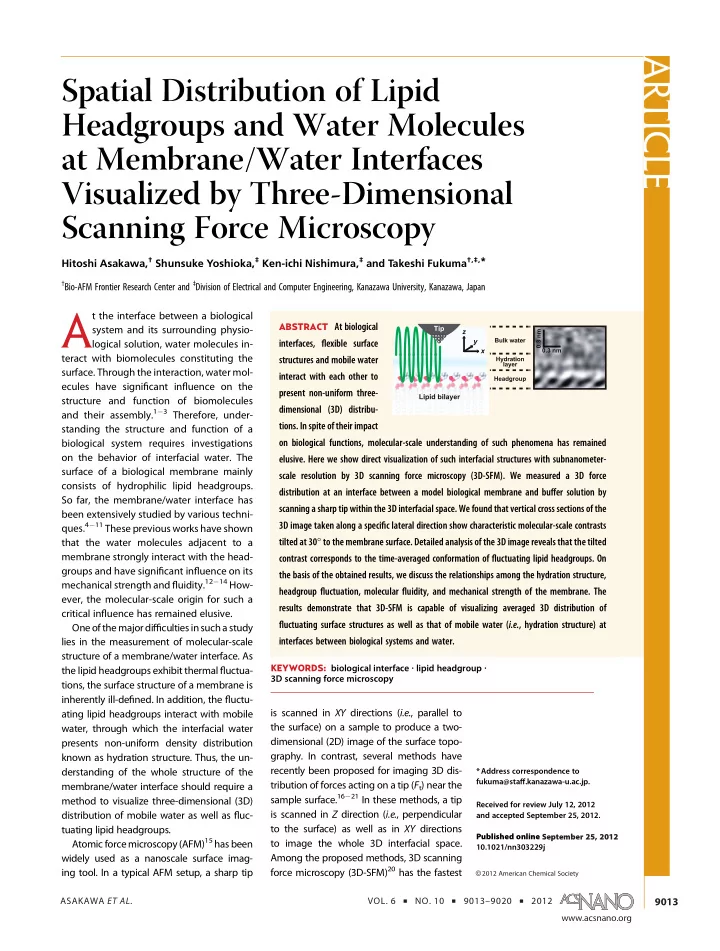
ABSTRACT At biological
interfaces, flexible surface structures and mobile water interact with each other to present non-uniform three- dimensional (3D) distribu-
- tions. In spite of their impact
- n biological functions, molecular-scale understanding of such phenomena has remained
- elusive. Here we show direct visualization of such interfacial structures with subnanometer-
scale resolution by 3D scanning force microscopy (3D-SFM). We measured a 3D force distribution at an interface between a model biological membrane and buffer solution by scanning a sharp tip within the 3D interfacial space. We found that vertical cross sections of the 3D image taken along a specific lateral direction show characteristic molecular-scale contrasts tilted at 30 to the membrane surface. Detailed analysis of the 3D image reveals that the tilted contrast corresponds to the time-averaged conformation of fluctuating lipid headgroups. On the basis of the obtained results, we discuss the relationships among the hydration structure, headgroup fluctuation, molecular fluidity, and mechanical strength of the membrane. The results demonstrate that 3D-SFM is capable of visualizing averaged 3D distribution of fluctuating surface structures as well as that of mobile water (i.e., hydration structure) at interfaces between biological systems and water.
KEYWORDS: biological interface . lipid headgroup . 3D scanning force microscopy