What Have We Learned from Meta-analyses of Clinical Trials 2016 - - PowerPoint PPT Presentation

what have we learned from meta analyses of clinical trials
SMART_READER_LITE
LIVE PREVIEW

What Have We Learned from Meta-analyses of Clinical Trials 2016 - - PowerPoint PPT Presentation

Prevention in Schizophrenia: The Earlier Use of Long Acting Injectable Medications What Have We Learned from Meta-analyses of Clinical Trials 2016 IPS: The Mental Health Services Conference in Washington DC Taishiro Kishimoto, M.D., Ph.D.


slide-1
SLIDE 1

2016 IPS: The Mental Health Services Conference in Washington DC

Taishiro Kishimoto, M.D., Ph.D.

Assistant Professor, Keio University School of Medicine, Tokyo, Japan Assistant Professor, Hofstra Northwell School of Medicine, NY, USA tkishimoto@keio.jp

Prevention in Schizophrenia: The Earlier Use of Long Acting Injectable Medications

What Have We Learned from Meta-analyses of Clinical Trials

slide-2
SLIDE 2

Disclosure

  • Consultant Fee

▫ Dainippon-Sumitomo, Meiji, Novartis, Prophase, Taisho

  • Speaker’s Honoraria

▫ Abbvie, Banyu, Dainippon-Sumitomo, Eli Lilly, Janssen, Mochida, Novartis, Otsuka, Pfizer, Shionogi

  • Scholarship

▫ The Byoutaitaisyakenkyukai Fellowship (Fellowship of Astellas Foundation of Research on Metabolic Disorders), The Japanese society

  • f Neuropsychopharmacology (Eli Lilly Fellowship for Clinical

Psychopharmacology)

  • Research Grant

▫ Danippon-Sumitomo, Otsuka, Mochida, Shionogi

  • Provision of Research Equipment

▫ Cisco, IIJ, V-cube, Omron, PST

  • No stocks or other income from any entity
slide-3
SLIDE 3

Natural History of Schizophrenia

Lieberm an, J.A. : Journal of Clinical Psychiatry, 57 (S.11), 68-71, 1996

Age (years old)

30 40 50 20 10 Good Poor

Function Psychopathology

Premorbid Prodromal Progression Stable relapsing

slide-4
SLIDE 4

Stopping m edication is the m ost powerful predictor of relapse

Year from the Previous Episode Relapse Rate [95%CI] Patients Rem aining at Risk at End of Year, No.

1st Relapse – 104 Pts at Risk 1 16.2 [8.9-23.4] 80 2 53.7 [43.4-64.0] 36 3 63.1 [52.7-73.4] 22 4 74.7 [64.2-85.2] 9 5 81.9 [70.6-93.2] 4 2nd Relapse – 63 Pts at Risk 1 19.1 [8.4-29.9] 36 2 48.7 [33.6-63.9] 17 3 56.0 [43.2-80.2] 10 4 56.0 [43.2-80.2] 3 5 78.0 [46.5-100.0] 1

Rob inson D, et a l. Arch Gen Psy chia try 199 9;56:24 1– 7

4.57 1 2 3 4 5 6 Second relapse

Risk of relapse when NOT taking m edication

slide-5
SLIDE 5

Leucht et al. Lancet 2012

slide-6
SLIDE 6

Leucht et al. Lancet 2012

AP continuation vs PBO for Relapse Prevention

slide-7
SLIDE 7

AP continuation vs PBO for Relapse Prevention: Sensitivity analyses

Leucht et al. Lancet 2012

slide-8
SLIDE 8

Adherence in Various Diseases

Disease # studies Mean Adherence (%) 95%CI HIV Disease 8 88.3 78.9-95.2 Arthritis 22 81.2 71.9-89.0 Cancer 65 79.1 75.9-86.2 Cardio Vascular Diseases 129 76.6 73.4-79.8 Infectious Disease 34 74.0 67.5-80.0 Diabetes 23 67.5 58.5-75.8

  • DiMatteo. Mecial Care 2004
slide-9
SLIDE 9

Non-/ Poor Adherence Rate in Schizophrenia Based on Real World Clinical Data

Country, Population Num ber of Patients Measurem ent Method Non-/ poor Adherence Schizophrenia, Norway (Jónsdóttir H et al. 2010) 280 Serum concentration 58.4% Schizophrenia, USA (Dibonaventura M et al. 2012) 876 Self-report 48.4% Schizophrenia, Nigeria (Adelufosi AO 2012) 313 Self-report 40.3% Schizophrenia, USA Medicaid beneficiaries (Gilmer TP et al. 2004) 2,801 Pharmacy Records 40% Schizophrenia, USA VA (Valenstein M et al. 2004) 63,214 Pharmacy Records 40% Schizophrenia, first episode (Perkins DO et al. 2008) 400 Discontinuation against medical advice 37.1% (K-M curve) 28.8% (raw) Schizophrenia, USA VA (Valenstein M 2006) 34,128 Pharmacy Records 36.0-37.1% Schizophrenia, France (Dassa D et al. 2010) 291 Self-report 30.0% Kane, Kishim oto and Correll. World psychiatry 2013

slide-10
SLIDE 10

Long Acting Injections Minim ise Therapy Disruptions

  • Assure medication delivery
  • Immediate awareness of non-adherence
  • No abrupt loss of efficacy if dose missed
  • Freedom from daily medication
  • etc.
  • Needle pain
  • Possible emergence of injection site side effects
  • Impossible to discontinue/ reduce dosage

immediately

  • etc.
slide-11
SLIDE 11

Time to Hospitalization after Randomization

n=182 n=187

Rosenheck et al. N Engl J Med 2011

RIS LAI vs Oral AP

  • Unstable Schizophrenia
slide-12
SLIDE 12

RIS LAI vs Oral Antipsychotics:

PROACTIVE Study

Buckley et al. Scz Bull 2014

slide-13
SLIDE 13
slide-14
SLIDE 14

Methods -Inclusion Criteria

  • RCTs comparing LAIs vs. OAPs
  • Long-term studies ( ≥ 6 months)
  • Providing relapse-related information

(e.g. study-defined relapse, rehospitalization)

  • Both in- and out-patient studies

Kishimoto T et al. Schizophrenia Bulletin 2013

slide-15
SLIDE 15

Methods -Outcom es

  • Primary outcome:
  • Relapse as defined in the original studies

(estimated rate derived from survival curve, raw rate if not available)

  • Secondary outcome:
  • Relapse at 3, 6, 12, 18, 24 months
  • All-cause discontinuation
  • Discontinuation due to adverse events
  • Drug inefficacy (relapse + discontinuation due to

inefficacy)

  • Hospitalization
  • Non-adherence

Kishimoto T et al. Schizophrenia Bulletin 2013

slide-16
SLIDE 16

Methods – Data Analysis

  • LAIs were compared to OAPs both individually and

pooled

  • Risk Ratio together with 95% CI
  • Random effect model
  • Number Needed to Treat

Kishimoto T et al. Schizophrenia Bulletin 2013

slide-17
SLIDE 17

# Studies 21 studies Publication Year 1974-2011 (There was 14 years gap between 1991 and 2005) # Patients 5130 (31 - 921 per study (median 105)) Duration 66.4 ± 32.2 weeks (< 1 year: N=4, > 1 year: N=17) Blinding Status Double blind, double dummy: 9 Rater-masked: 5 Open label: 7 LAI Medication Fluphenazine 8, HAL1, Trifluperazine 1, Zuclopenthixol 1, RIS 9, OLA 2 Oral Medication Fluphenazine 4, Pimozide 2, HAL 1, Trifluperazine 1, Zuclopenthixol 1, OLA 4, QUE 2, RIS 2, ARI 1, previous/ physician’s choice 3 LAI drug was different from oral drug: 11/ 21

Results: Study Characteristics

Kishimoto T et al. Schizophrenia Bulletin 2013

slide-18
SLIDE 18

LAI vs Oral AP Relapse (Individual LAI)

Kishimoto T et al. Schizophrenia Bulletin 2013

slide-19
SLIDE 19

Kishimoto T et al. Schizophrenia Bulletin 2013

slide-20
SLIDE 20

LAI vs Oral AP: Relapse (Pooled)

Kishimoto T et al. Schizophrenia Bulletin 2013

slide-21
SLIDE 21

LAIs vs OAPs: Relapse Specific Tim e Points

N n Relative Risk [95%CI] P Relapse at 3 month 11 3588 0.91 [0.70, 1.17] 0.21 Relapse at 6 month 13 4045 0.93 [0.76, 1.14] 0.48 Relapse at 12 month 16 3437 0.90 [0.75, 1.08] 0.27 Relapse at 18 month 6 2296 0.87 [0.67, 1.13] 0.29 Relapse at 24 month 7 2359 0.92 [0.70, 1.19] 0.51

Kishimoto T et al. Schizophrenia Bulletin 2013

slide-22
SLIDE 22

LAIs vs OAPs: Other Outcom es

N n Relative Risk [95%CI] P All cause discontinuation 20 4837 1.00 [0.89, 1.12] 0.40 Hospitalization 10 2296 0.88 [0.76, 1.03] 0.11 Drug inefficacy (relapse + dropout due to inefficacy) 21 4924 0.97 [0.82, 1.15] 0.73 Dropout due to adverse events 19 4917 1.10 [0.73, 1.64] 0.66 Non-adherence 10 1973 0.77 [0.50, 1.20] 0.46

Kishimoto T et al. Schizophrenia Bulletin 2013

slide-23
SLIDE 23

LAIs vs OAPs: Relapse Sensitivity Analyses

Subgroup N n RR 95%CI P Double blind double dummy 9 1717 0.86 [0.68, 1.09] 0.21 Outpatient status 16 3790 0.89 [0.76, 1.05] 0.17 >1 year 15 3425 0.91 [0.77, 1.07] 0.25 Same AP in LAI and OAP arm 10 2544 0.92 [0.78, 1.09] 0.35 Outpatient status + ≥1 year 13 2815 0.87 [0.74, 1.04] 0.12

Kishimoto T et al. Schizophrenia Bulletin 2013

slide-24
SLIDE 24
slide-25
SLIDE 25

Pt 1 Pt 2 Pt 3 Pt 4 Pt 5 Pt 6

Mirror-Im age Study

Long Acting Injection Oral Antipsychotics Adm ission

Mirror-image study compares what happens before and after the introduction of a new treatment, using equal intervals. Each patient serve as his/ her own control.

slide-26
SLIDE 26

Kishimoto T et al. J Clin Psych 2013

Inclusion Criteria:

  • Mirror-image study comparing the period before and

after the initiation of LAI

  • ≥12 months (≥6moths each on OAP and LAI)
  • Studies providing hospitalization or relapse-related

information. Co-Prim ary outcom es:

  • Hospitalization risk (proportion of pts who had ≥1

hospitalization), # of hospitalization Secondary outcom es:

  • hospitalization days, length of 1 hospitalization.
slide-27
SLIDE 27

Number of Studies 25 Number of Countries 28 Publication Year 1971-2012 Number of Patients Total 5825 (24-2300 per study) Mean study duration 20.9±15.9 months (6-69.6 months) Prospective Studies (in the post- LAI phase) 3/ 25 LAI Medication RIS 11, first generation antipsychotics (FGA) 11, RIS or FGA1, not reported 2 Oral Medication Any 3, SGA 1, OLA1, not reported 20

Result: Mirror Im age Study Characteristics

Kishimoto T et al. J Clin Psych 2013

slide-28
SLIDE 28

Study name Outcome Statistics for each study Risk ratio and 95% CI Risk Lower Upper ratio limit limit Z-Value p-Value G irardi et al. 2010 Hospitaliz ation Risk 0.024 0.001 0.397

  • 2.609

0.0091 B eauclair et al. 2005 Hospitaliz ation Risk 0.092 0.030 0.282

  • 4.166

0.0000 A rato & Erdos 1979 Hospitaliz ation Risk 0.204 0.119 0.350

  • 5.761

0.0000 Devito et al. 1978 Hospitaliz ation Risk 0.281 0.183 0.430

  • 5.844

0.0000 Denham & A damson 1971 Hospitaliz ation Risk 0.333 0.254 0.438

  • 7.884

0.0000 M

  • rritt 1974

Hospitaliz ation Risk 0.343 0.214 0.550

  • 4.440

0.0000 Lam et al. 2009 Hospitaliz ation Risk 0.369 0.327 0.415 -16.569 0.0000 Lindholm 1975 Hospitaliz ation Risk 0.391 0.232 0.660

  • 3.515

0.0004 P eng et al. 2011 Hospitaliz ation Risk 0.452 0.321 0.636

  • 4.554

0.0000 G

  • ttfries &

G reen 1974 Hospitaliz ation Risk 0.500 0.324 0.771

  • 3.136

0.0017 Rosa et al. 2012 Hospitaliz ation Risk 0.529 0.251 1.116

  • 1.672

0.0944 Chang et al. 2012 Hospitaliz ation Risk 0.557 0.437 0.711

  • 4.697

0.0000 Johnson & Freeman 1972 Hospitaliz ation Risk 0.570 0.461 0.704

  • 5.203

0.0000 Crivera et al. 2011 Hospitaliz ation Risk 0.597 0.463 0.768

  • 4.003

0.0001 Ren et al. 2011 Hospitaliz ation Risk 0.663 0.611 0.720

  • 9.746

0.0000 S vestka et al. 1984 Hospitaliz ation Risk 1.286 0.541 3.056 0.569 0.5694 0.428 0.349 0.525

  • 8.113

0.0000 0.1 0.2 0.5 1 2 5 10 Favours LAI Favours OAP

LAI vs. Oral Antipsychotics Mirror-Im age Studies [Hospitalization Risk]

16 studies, 4066 patients Risk Ratio=0.43, 95%CI:0.35-0.53, p<0.0001 NNT=3

Kishimoto T et al. J Clin Psych 2013

slide-29
SLIDE 29

Study nam e Outcom e Statistics for each study R ate ratio and 95% C I R ate Lower U pper ratio lim it lim it Z-Value p-Value B ea ucla ir et al. 2 00 5 # H

  • spitaliz

a tio n .10 3 .04 4 .23 9

  • 5

.2 98 .00 A ra to & E rdo s 19 79 # H

  • spitaliz

a tio n .10 6 .06 2 .18 2

  • 8

.1 40 .00 W a ldm a n & N e u m a n 19 8 4 # H

  • spitaliz

a tio n .20 1 .13 7 .29 6

  • 8

.1 43 .00 D en ha m & A da m so n 19 7 1 # H

  • spitaliz

a tio n .26 2 .19 2 .35 7

  • 8

.4 37 .00 M

  • rritt 1

97 4 # H

  • spitaliz

a tio n .28 3 .16 5 .48 5

  • 4

.5 90 .00 M alm 19 71 # H

  • spitaliz

a tio n .29 4 .17 9 .48 4

  • 4

.8 11 .00 D evito e t al. 1 97 8 # H

  • spitaliz

a tio n .35 5 .23 9 .52 8

  • 5

.1 13 .00 P

  • lo

n

  • w

ita & Jam e s 19 76 # H

  • spitaliz

a tio n .41 4 .26 9 .63 9

  • 3

.9 90 .00 1 C ha ng e t al. 2 01 2 # H

  • spitaliz

a tio n .43 .31 8 .58

  • 5

.5 19 .00 C arsw ell e t a

  • l. 20

1 # H

  • spitaliz

a tio n .44 1 .38 1 .51 1 -1 0.98 3 .00 L ind ho lm 1 9 75 # H

  • spitaliz

a tio n .44 7 .29 9 .67

  • 3

.8 99 .00 1 P en g et al. 2 01 1 # H

  • spitaliz

a tio n .46 9 .33 1 .66 6

  • 4

.2 32 .00 R en e t a

  • l. 20

1 1 # H

  • spitaliz

a tio n .74 2 .68 2 .80 8

  • 6

.8 98 .00 T an e t a

  • l. 19

81 # H

  • spitaliz

a tio n .80 .64 1 .99 9

  • 1

.9 68 .04 9 1 B

  • u

rin e t a

  • l. 19

9 8 # H

  • spitaliz

a tio n 1 .34 6 1 .13 7 1 .59 5 3 .44 1 .00 6 .38 1 .28 3 .51 3

  • 6

.3 72 .00 0.1 0.2 0.5 1 2 5 10 Favours LA I Favours OA P

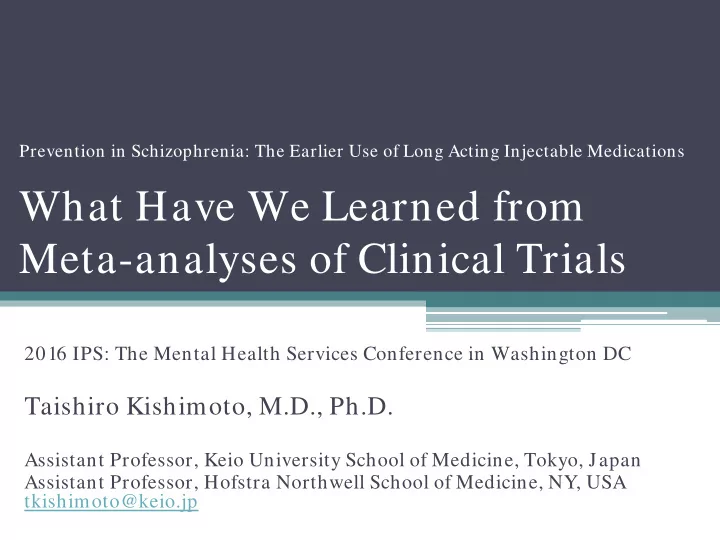
LAI vs. Oral Antipsychotics Mirror-Im age Studies [# of Hospitalization]

15 studies, 6396 person years Rate Ratio=0.38, 95%CI:0.28-0.51, p<0.0001 NNT=2

Kishimoto T et al. J Clin Psych 2013

slide-30
SLIDE 30

Outcomes

Study N

Effect Size [95%CI] P-value Secondary Outcomes Days Hospitalized 7 Hedge’s g 0.77 0.22-1.33 <0 .0 1 Length of 1 Hospitalization 2 Hedge’s g 0.21 0.13-0.29 <0 .0 0 1 Sensitivity Analysis Hospitalization Risk FGA-LAI=Old studies (-1999) 8 Risk ratio 0.40 0.30-0.53 <0 .0 0 1 SGA-LAI 7 Risk ratio 0.46 0.33-0.64 <0 .0 0 1 New studies (2000-) 8 Risk ratio 0.46 0.34-0.62 <0 .0 0 1 ITT analysis 6 Risk ratio 0.54 0.51-0.58 <0 .0 0 1 # of Hospitalization FGA-LAI=Old studies (-1999) 10 Risk ratio 0.36 0.22-0.61 <0 .0 0 1 SGA-LAI 4 Risk ratio 0.42 0.27-0.65 <0 .0 0 1 New studies (2000-) 5 Risk ratio 0.43 0.29-0.63 <0 .0 0 1 ITT analysis 5 Risk ratio 0.42 0.29-0.63 <0 .0 0 1

Kishimoto T et al. J Clin Psych 2013

slide-31
SLIDE 31

Mirror Im age Studies: Major Lim itations

Expectation Bias The clinician and family know that the patient is still on medication Regression to the Mean Patients are likely to return to their usual status after a while even if the medication remains unchanged Switch from OAPs to LAIs All studies included in the analysis was from OAPs to LAIs Time Effect Health policy change and reduction in bed numbers or insurance coverage

slide-32
SLIDE 32
slide-33
SLIDE 33

What is the m ost inform ative design to exam ine LAI efficacy?

Study Design Result Lim itation

RCT LAI ≈ Oral

  • Selection bias (pts in RCT are more

adherent)

  • Alterations to the ecology of treatment

delivery and experience (reminder, assessment, compensation etc.) Mirror-Image Study LAI » Oral

  • Expectation bias, influence of

independent factors (bed reduction etc.) Cohort Study Hetero- geneous

  • Selection bias (pts on LAI are more

severe)

Kishimoto T et al. SIRS 2012

slide-34
SLIDE 34

Long Acting Injectable Risperidone vs Oral Risperidone in First Episode

Subotnik et al JAMA Psych 2015

slide-35
SLIDE 35

Paliperidone Palm itate vs Oral APs (PROSIPAL) in recently diagnosed schizophrenia

Schreiner et al. Schizophrenia Res 2015
slide-36
SLIDE 36

J Clin Psychi 2015

slide-37
SLIDE 37

Safety and tolerability of LAI vs oral antipsychotics: RCT com paring the sam e antipsychotics

Misawa, Kishimoto et al. Schizphr Res 2016

Discontinuation due to adverse events

16 RCTs (n=4902, mean age=36.4 years, males=65.8%, schizophrenia=99.1%)

slide-38
SLIDE 38

All Cause Death Death Excluding Accident and Suicide

LAIs and OAPs did not differ significantly regarding 115/ 119 adverse events including discontinuation due to AE, death, serious adverse events. Compared to OAPs, LAIs were associated with significantly more akinesia, low-density lipoprotein cholesterol change and anxiety. LAIs were associated with significantly lower prolactin change.

Misawa, Kishimoto et al. Schizphr Res 2016

slide-39
SLIDE 39

Sum m ary 1

  • In RCTs, LAIs are not superior to OAPs in

preventing relapse as well as other relapse- related outcomes.

  • Patients in RCTs might enroll a disproportionate

number of patients with better adherence and lower illness severity.

  • Some newer evidences show LAIs superiority
  • ver OAPs in recent onset and/ or specific

patient populations.

slide-40
SLIDE 40

Sum m ary 2

  • LAIs are more effective than OAPs in real world

evidence

  • Mirror image studies
  • Cohort studies
  • Safety: There is no convincing evidence that

LAIs are more dangerous than OAPs.

slide-41
SLIDE 41

Taishiro Kishimoto, M.D., Ph.D.

Assistant Professor, Keio University School of Medicine, Tokyo, Japan Assistant Professor, Hofstra Northwell School of Medicine, NY, USA tkishimoto@keio.jp

Thank you very much for your attention.