
SLIDE 1
Street Surface Infrastructure Management
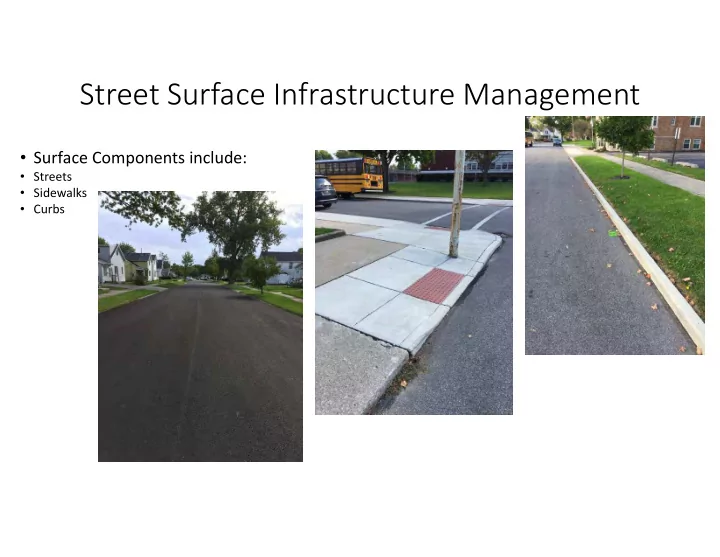
- Surface Components include:
- Streets
- Sidewalks
- Curbs
Street Surface Infrastructure Management Surface Components include: - - PowerPoint PPT Presentation
Street Surface Infrastructure Management Surface Components include: Streets Sidewalks Curbs Street Surface Age 2000 Burning Tree 2015 Willow Bay New 1985 Precision Way We manage our Streets, Sidewalks, and Curbs based on age
Sidewalks, and Curbs based on age and condition of the asset.
such as our streets, we can project its useful lifetime, and use this info to plan our maintenance activities. 2015 Willow Bay‐ New 2010 Jackson 2005 Bristow 2000 Burning Tree 1995 Inverness 1990 Waterford 1985 Precision Way 1980? Pontiac
Sidewalks, and Curbs based on age and condition of the asset.
such as our streets, we can project its useful lifetime, and use this info to plan our maintenance activities.
ranges
20‐30
ranges
20‐30
Streets
Micro‐surfacing Paving ADA Curb access ADA Ramps
Pinehurst Ayersville Meadowbrook Corwin
Treatment Options:
life
Treatment Options:
life
Treatment Options:
life
Treatment Options:
life
Treatment Options:
life
Treatment Options:
life
Treatment Options:
life
Options:
(based on 95.3Mi @ 20 yr life, to maintain current status quo) ‐Need to resurface 4 Mi. of streets/yr. ‐Need to Micro‐surf 2.4 Mi. of streets /yr.
(does not include extensive curb
additional 25.8Mi. over the next 5 years. This growth can be limited to 9.8Mi., or 39.9Mi. total backlog, if we follow our 4Mi./yr. Resurfacing & 2.4Mi./yr. microsurfacing schedule.
2.7 Mi. of streets per decade (based on
decade of 2000‐2010)
(not including state routes or private streets)
$55/LF and 50% @ $35/LF cost, remove and replace curb on both sides of the street.)
(not including state routes or private streets)
$55/LF and 50% @ $35/LF cost, remove and replace curb on both sides of the street.)
(not including state routes or private streets)
$55/LF and 50% @ $35/LF cost, remove and replace curb on both sides of the street.)
Curb & Gutter removal and replacement‐ Fairlawn St. Curb & Sidewalk removal and replacement‐ Arabella St.
Existing Roll Curb & Gutter Sunset Dr. Pontiac Dr. Defiance Crossing Precision Way Existing Standing Curb & Gutter Age deterioration Subgrade failure
Existing Straight Curb Wilhelm Wood Ties Perry Sandstone Concrete Parking Blk Molded Asphalt Age deterioration
the curb condition for all curbed city streets.
2010 (5yrs) Defiance Crossing 2005 (10yrs) Maumee Riv Cross. 2000 (15yrs) Burning Tree 1995 (20yrs) Inverness 1990 (25yrs) Edgewood 1985 (30yrs) Precision Way 1975 (40yrs) Wilson St 1965 (50yrs) Northwood
Pct Def LF Curb #Pcs rplcd #Def Cracks Chips
3% 3634 352 9 6 3
5% 7100 687 33 23 10
8% 3572 370 30 10 15 5
8% 1704 170 15 1 9 4
10% 1274 123 3 9 3 3 3
29% 5374 520 32 119 10 36 73
49% 4468 447 41 176 24 13 129
48% 2660 266 46 81 22 16 43
75 yr. life expectancy 50% C&G 44.7 Mi @ $55/LF=$173,078 50% straight curb 44.7 Mi @ $35/LF= $116,435 total= $289, 513/yr.
budgeting $0.
2010 (5yrs) Defiance Crossing 2005 (10yrs) Maumee Riv Cross. 2000 (15yrs) Burning Tree 1995 (20yrs) Inverness 1990 (25yrs) Edgewood 1985 (30yrs) Precision Way 1975 (40yrs) Wilson St 1965 (50yrs) Northwood
deterioration: Pinehusrt 1976 40yrs Woodhurst 1973 43 Ruth Ann 1971 45 Edgewood 1967 49 Sunset 1965 51 Terrawanda Dr. S 1964 52 Terrawanda Dr. N 1956 60 Elliott Lane 1957 59 Northwood 1965 51 Wilson 1975 41 Ralvan 1964 52 Tanglewood 1967 49
2.9Mi x 2= 5.9Mi @ $55/LF= $1,713,360
sidewalks (approx. 35% of 127
Routes but not Private Streets.
($12/SF cost, remove and replace, 5’ wide walk on both sides of the street.)
established the Curb Ramp Transition Plan.
ramp installations, 1992‐2007, 26 ramps/yr, at $15,000/yr. with first 5 yrs located on the map, for a total of 390 ramps to be installed.
identified for Ward 1.
established the Curb Ramp Transition Plan.
ramp installations, 1992‐2007, 26 ramps/yr, at $15,000/yr. with first 5 yrs located on the map, for a total of 390 ramps to be installed.
identified for Ward 1.
established the Curb Ramp Transition Plan.
ramp installations, 1992‐2007, 26 ramps/yr, at $15,000/yr. with first 5 yrs located on the map, for a total of 390 ramps to be installed.
identified for Ward 1.
Truncated Domes worn off and settled Curb is a barrier Curb is a barrier Previously compliant Mat worn and settled No Mat
established the Curb Ramp Transition Plan.
ramp installations, 1992‐2007, 26 ramps/yr, at $15,000/yr. with first 5 yrs located on the map, for a total of 390 ramps to be installed.
identified for Ward 1.
Curb cut
No Curb barrier Proper slope
Curb lowered
Mat
for the ADA Accessibility Law. The Federal Gov. is making a push to have local agencies re‐ evaluate where they are with implementation of ADA Access requirements, via the Transition Plans.
agencies with more than 50 employees.
intersections needing accessible upgrades, via a survey assessment.
budgeted cost.
access points, potentially 3340 access
295 non compliant 470 previously compliant 905 compliant
295 @$600/each=$177,000 470 x .75=353@ $1500/ea=$529,500 total= $706,500
353 points/25yrs. = 14 Access point nstallations/yr. = $21,000/yr.
($120,000) to update 40 access points,
ramps to be installed.
1) Areas that have sidewalks but are not currently
2) Areas that have sidewalks and were previously compliant, but are no longer
current deficiencies, or 5.7 years worth
($120,000) to update 40 access points,
ramps to be installed.
1) Areas that have sidewalks but are not currently
2) Areas that have sidewalks and were previously compliant, but are no longer
current deficiencies, or 5.7 years worth
295 non compliant 470 previously compliant 905 compliant
295@ $600/each=$177,000 470 x .75=353@ $1500/ea=$529,500 total= $706,500
353 points/25yrs. = 14 Access point install/yr. = $21,000/yr.
75 yr. life expectancy 50% C&G 44.7 Mi @ $55/LF=$173,078 50% straight curb 44.7 Mi @ $35/LF= $116,435 total= $289,513/yr.
street per year.
(based on 95.3Mi @ 20 yr life, to maintain current status quo) ‐Need to resurface 4 Mi. of streets/yr. ‐Need to Micro‐surf 2.4 Mi. of streets /yr.
(does not include extensive curb or street rehabilitation)
2000‐2010)