
SLIDE 1
1
Western Horse Mackerel Multi- annual Management
by Beatriz A. Roel
*
Strategies compared and approach taken
- Constant catch strategies vs slope with a
50% fixed component.
- Final results without spasmodic
recruitment.
- Period of the simulations is 40 years
- Fishing patterns as observed in 2003-
2005.
- Biomass reference point (Bref) is SSB
1982.
Features of the strategies
- TAC is kept fixed = TARGET YIELD if
SSB (based on assessment)> SSBref.
– If SSB<SSBref, TAC is reduced linearly.
- SLOPE with fixed component (survey
- nly)
TACy+1 = ½ *FIX + ½ f(slope)* TACprevious
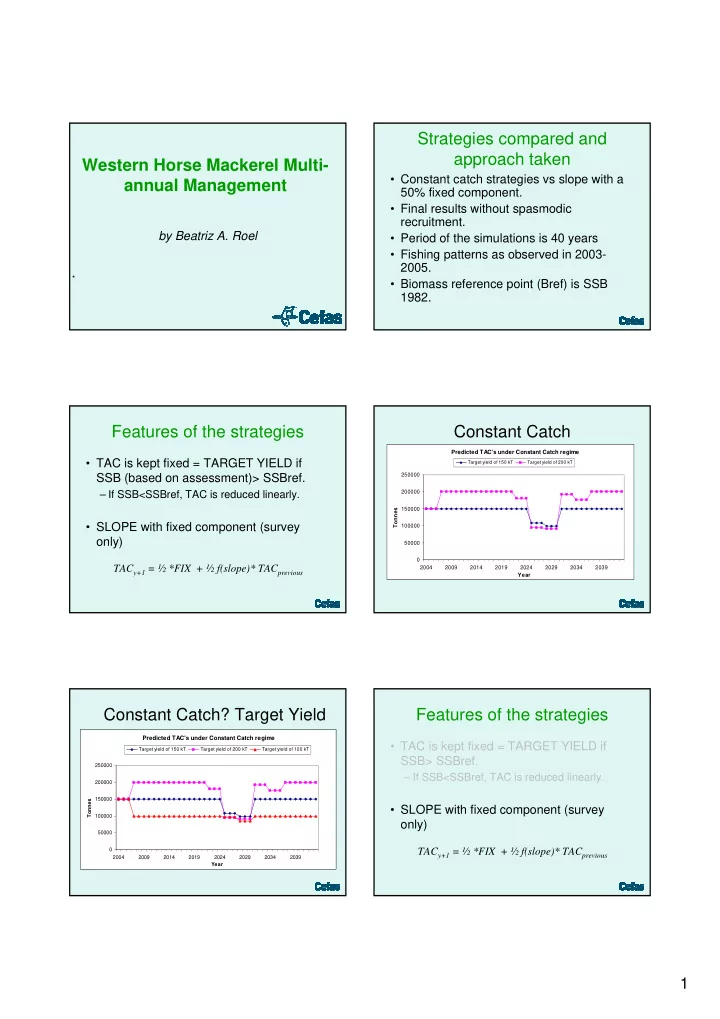
Constant Catch
Predicted TAC's under Constant Catch regime 50000 100000 150000 200000 250000 2004 2009 2014 2019 2024 2029 2034 2039 Year Tonnes
Target yield of 150 kT Target yield of 200 kT
Constant Catch? Target Yield
Predicted TAC's under Constant Catch regime
50000 100000 150000 200000 250000 2004 2009 2014 2019 2024 2029 2034 2039 Year Tonnes Target yield of 150 kT Target yield of 200 kT Target yield of 100 kT
Features of the strategies
- TAC is kept fixed = TARGET YIELD if
SSB> SSBref.
– If SSB<SSBref, TAC is reduced linearly.
- SLOPE with fixed component (survey
- nly)