
SLIDE 1
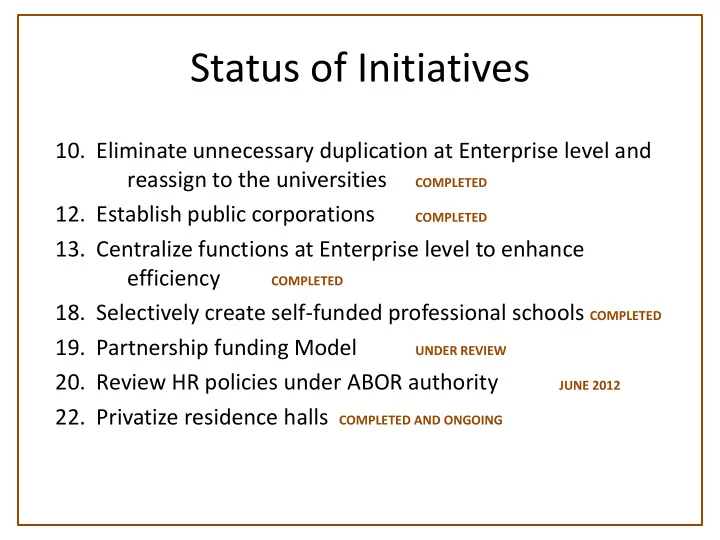
Status of Initiatives
- 10. Eliminate unnecessary duplication at Enterprise level and
reassign to the universities
COMPLETED
- 12. Establish public corporations
COMPLETED
- 13. Centralize functions at Enterprise level to enhance
efficiency
COMPLETED
- 18. Selectively create self-funded professional schools COMPLETED
- 19. Partnership funding Model
UNDER REVIEW
- 20. Review HR policies under ABOR authority
JUNE 2012
- 22. Privatize residence halls COMPLETED AND ONGOING