
SLIDE 1
- B. Spruck, Uni Mainz, 3.3.2016, p. 1
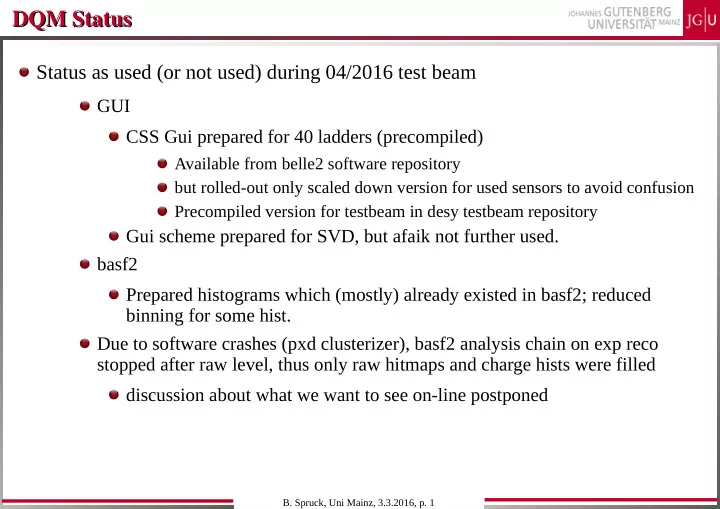
DQM Status DQM Status Status as used (or not used) during 04/2016 - - PowerPoint PPT Presentation
DQM Status DQM Status Status as used (or not used) during 04/2016 test beam GUI CSS Gui prepared for 40 ladders (precompiled) Available from belle2 software repository but rolled-out only scaled down version for used sensors to avoid confusion
pxd/hPXDAverageSeedByStartRow1 pxd/hPXDAverageSeedByStartRow2 pxd/hPXDClusterCharge1 pxd/hPXDClusterCharge2 pxd/hPXDClusters1 pxd/hPXDClusters2 pxd/hPXDDigitCharge1 pxd/hPXDDigitCharge2 pxd/hPXDFired1 pxd/hPXDFired2 pxd/hPXDHitmapU1 pxd/hPXDHitmapU2 pxd/hPXDHitmapV1 pxd/hPXDHitmapV2 pxd/hPXDSeed1 pxd/hPXDSeed2 pxd/hPXDSeedCountsByStartRow1 pxd/hPXDSeedCountsByStartRow2 pxd/hPXDSeedCountsByU1 pxd/hPXDSeedCountsByU2 pxd/hPXDSeedCountsByV1 pxd/hPXDSeedCountsByV2 pxd/hPXDSize1 pxd/hPXDSize2 pxd/hPXDSizeU1 pxd/hPXDSizeU2 pxd/hPXDSizeV1 pxd/hPXDSizeV2 pxdraw/hrawPxdChargeMap_$(ID) pxdraw/hrawPxdCount pxdraw/hrawPxdHitMapAll pxdraw/hrawPxdHitMap_$(ID) pxdraw/hrawPxdHitsCharge_$(ID) pxdraw/hrawPxdHitsCommonMode_$(ID) pxdraw/hrawPxdPackets pxdraw/hrawPxdPacketSize pxdrawroi/hrawROIcount pxdrawroi/hrawROIDC_DHHID pxdrawroi/hrawROItype