SLIDE 1
Static map for micro-planning purposes (REC approach) A base map is - - PDF document
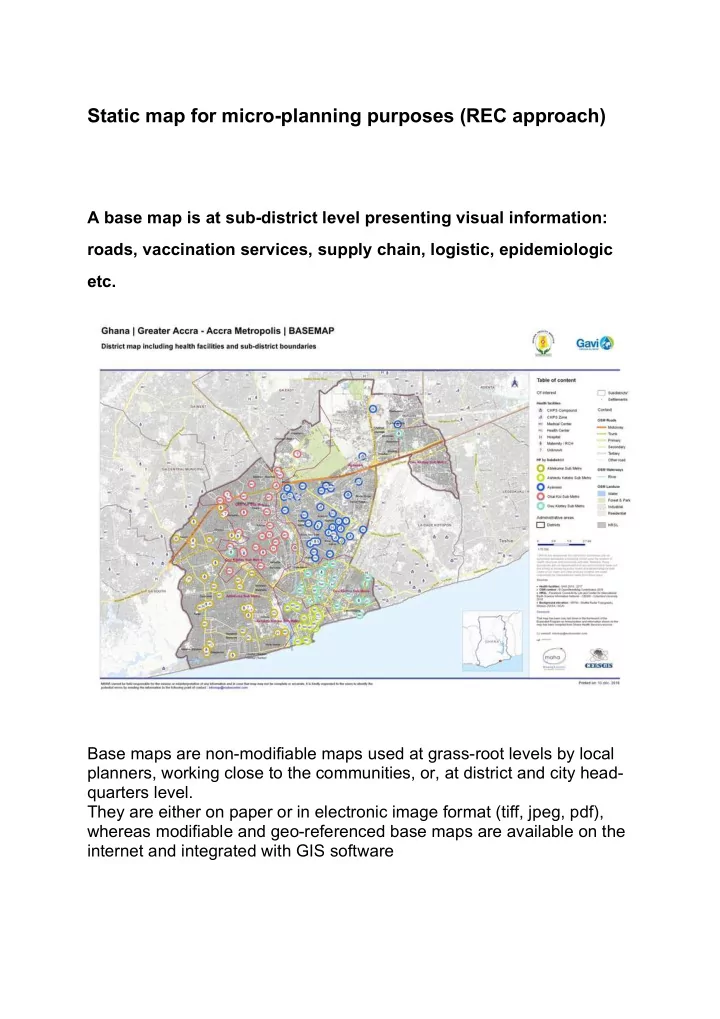
Static map for micro-planning purposes (REC approach) A base map is at sub-district level presenting visual information: roads, vaccination services, supply chain, logistic, epidemiologic etc. Base maps are non-modifiable maps used at grass-root
SLIDE 2
SLIDE 3
When using a base map, you can visualize at a glance many layers of
- information. Having a geographic overview of a situation can dramatically
improve evidence-based decision-making. From printed base maps to EPI sector specific dynamic maps so to quickly visualize the evolution of a situation through time ( See EPI Monitoring map), geographic information is vital for a good understanding of a situation. The typical hurdles in urban are as follows: (i) Lack of updated health facility catchment maps and high-risk area information; (ii) Lack of granular geographical data, especially for the sake of appraising accessibility or the distance between households and vaccination sites; (iii) Poor delivery approaches to meet the needs of growing urban poor populations.
SLIDE 4
The added-value of using static maps are as follows: (1) Efficient micro plans and good accountability of vaccination teams: Mapping spatial location of immunization infrastructure, human resources, population distribution and geographic features at district
- r/and urban area level, using GPS tools and interpretation of satellite
imagery, will lead to more efficient planning of outreach sessions based
- n distances, population in need and geographic barriers, and
improved monitoring and accountability of immunization teams. (2) Efficient use of vaccination resources (human resources, stocks, cold chain): More geographically accurate maps of resources versus populations, together with spatial analysis of the barriers between supply and demand, can lead to better identification of gaps in supply to optimize match with demand for services. (3) Evidence of new well targeted communities, which were chronically missed: demonstrated, for example, by pockets of disease despite reported high vaccination coverage. More efficient micro plans and use
- f GPS and satellite images could lead to a strong reduction of
chronically missed communities in even hard-to-reach areas. There are many themes for mapping purposes: Health facilities: Showing locations in relation to access etc. May be sub- divided e.g. medical, vaccination spots, staff numbers etc. 2 Health facilities: Showing locations in relation to supply chain factors, including cold chain e.g. numbers of people to be vaccinated, geographical barriers, catchment areas, etc. 3 Catchment areas and patient provenance: For example, the trial map showing origins of children vaccinated 4 Vaccination needs and planning: E.g. in relation to mobile clinics and
- ther facilities.