STATE BROADBAND POLICY: IMPACTS ON AVAILABILITY Brian Whitacre - - PowerPoint PPT Presentation

state broadband policy impacts on availability
SMART_READER_LITE
LIVE PREVIEW

STATE BROADBAND POLICY: IMPACTS ON AVAILABILITY Brian Whitacre - - PowerPoint PPT Presentation

https://www.sciencedirect.com/science/article/pii/S030859612030 1178 STATE BROADBAND POLICY: IMPACTS ON AVAILABILITY Brian Whitacre Roberto Gallardo Presentation for Sept. 2020 RBEC Meeting Background Provision of broadband Internet is


slide-1
SLIDE 1

https://www.sciencedirect.com/science/article/pii/S030859612030 1178

STATE BROADBAND POLICY: IMPACTS ON AVAILABILITY

Presentation for Sept. 2020 RBEC Meeting

Brian Whitacre Roberto Gallardo

slide-2
SLIDE 2

Background

  • Provision of broadband Internet is an increasingly important topic
  • Highlighted by COVID-19 pandemic
  • Rural areas have continued to lag behind in terms of broadband availability
  • Broadband is important for a host of rural (and urban) economic outcomes

(Kim and Orazem, 2017; Kandilov et al. 2017; Whitacre et al. 2014)

  • States have taken different approaches to broadband policy
  • Some have state broadband offices with full-time employees
  • Others have state-level funding mechanisms
  • Some restrict cooperatives / municipalities from providing broadband
  • Little to no empirical evidence regarding which policies work

2

slide-3
SLIDE 3

Previous Research on Broadband Policy

  • Limited number of studies have examined U.S. broadband policy

efforts

  • One early study concluded most state-level policies (tax incentives, universal

service funds, municipal restrictions) were ineffective at promoting broadband penetration (Wallsten, 2005)

  • Another early study argued that policies focused on increasing demand were most

effective (Falch, 2007)

  • Siefer (2015) lays out elements of “good” state broadband policy but stops short
  • f empirically documenting their impacts.
  • Lack of research likely due to no clear source of information on state-level policies

Existing literature does not speak to effectiveness of state-level broadband policy in U.S.

3

slide-4
SLIDE 4

ision

Research Questions

  • Do state-level broadband policies impact overall availability?
  • What about rural availability?
  • Which broadband policies are most effective – and what is the magnitude of

their impact?

  • Existence of state-level broadband office with full-time employees
  • Existence of state-level funding mechanism
  • Existence of state-level restrictions on cooperative / municipal broadband prov

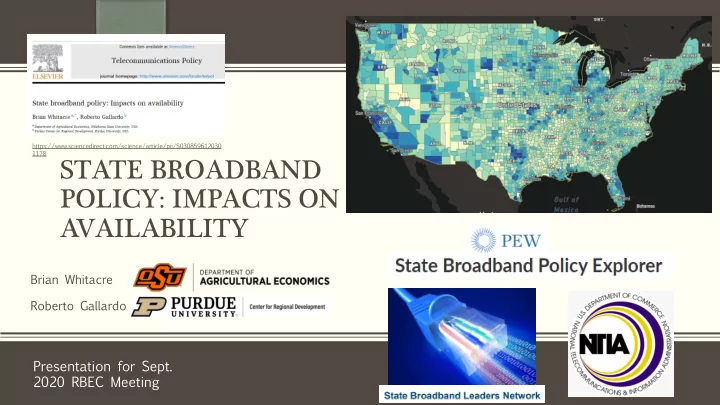
Source: Broadbandnow.com

4

slide-5
SLIDE 5

Data & Methods

  • Dependent Variable: County % of Population with Access to 25/3
  • Aggregated from Census Block-level data
  • National Broadband Map (2010 – 2013)
  • Federal Communications Commission (2014 – 2018)
  • Other availability metrics of interest:
  • County % of Population with access to fiber
  • County % of Population with at least 2 providers offering 25/3 speeds
  • Also compiled “rural-only” metrics using Census Blocks classified as rural in 2010
  • Primary Independent Variables of Interest: State Broadband Policies
  • Other county-level Control Variables
  • Income

Sources:

  • Education
  • US Census American Community
  • Poverty Rates

Survey

  • Population Density
  • US Census SAIPE
  • % Houses built after 2010
  • BLS - LAUS
  • Topography
  • USDA ERS Natural Amenities Scale

Panel Dataset from 2012 – 2018 (3,140 counties)

5

slide-6
SLIDE 6
  • licies

ritable Trusts 2019 el statutes, executive orders, ves for broadband-related

  • llection of state-level

h task force / agency, but funding for full-time became defunct (not ent out to State Broadband N) to confirm our initial

State Broadband P

  • Initial Summary
  • Compiled by Pew Cha
  • Initially available July
  • Reviewed all state-lev

and governing directi terms dating to 1991

  • First comprehensive c

policies

  • Ground-truthing
  • Statutes may establis

unclear if it provides employees

  • Several organizations

captured in dataset)

  • Personalized emails s

Leaders Network (SBL assessment

6

  • 31 of 50 states responded (62%)
slide-7
SLIDE 7

Data & Methods

7

slide-8
SLIDE 8

The Elephant in the Room…

  • Major problems

with FCC broadband data

  • Coverage of any part of

census block = service in entire block

  • Max advertised speeds,

not actual

  • No cost data
  • Incorrect submissions by

But,

providers

it remains the best / most complete data we have available

8

slide-9
SLIDE 9

Broadband Availability, 2012-2018

County averages

FCC Population-Based Availability Estimates

2017 2018 All 93.5% 94.4% Rural 73.7% 77.7%

9

slide-10
SLIDE 10

State Broadband Policies, 2012 & 2018

10% 50% 8% 36% 44% 40%

10

slide-11
SLIDE 11

Data & Methods (cont’d)

Demographics

11

slide-12
SLIDE 12

Empirical Specification (Insert Glossy Eyes Here)

Dynamic Panel Regression Dependent Variable: % of Population with 25/3 access in county i at time t Lagged Dependent Variable

Problem: Strict Exogeneity of Regressors Does Not Hold

Control Variables:

  • Poverty Rates
  • Education
  • Population Density
  • Rural % of Population
  • Topography

County Fixed Variables of Interest Effects Year Fixed Effects “Nickell Bias”

12

slide-13
SLIDE 13

First-Differencing But, endogeneity is still an issue for other variables (#$%"&'"()*) Do states leading / lagging in availability enact more broadband-related legislation? Solve with Instrumental Variables A Commonly-used Approach: Difference (or System) Generalized Method of Moments (GMM)

13

Empirical Specification (More Glossy Eyes)

Picks up Policy Removes County Changes Fixed Effects (No !")

slide-14
SLIDE 14

Results

Municipal restrictions lower availability 2-3%

14

State funds increase availability 1-2% Intuitive results for controls

Some evidence of state office effectiveness

Pass specification tests

slide-15
SLIDE 15

Results - Rural

Intuitive results for controls Municipal restrictions lower availability 2-4% State funds increase availability 1-2%

15

slide-16
SLIDE 16

Study Summary in 2 slides:

  • 2012-2018
  • County-level data
  • 18,833 observations
  • Dynamic panel regression
  • FCC Form 477
  • ACS 5-year
  • Pew Charitable Trusts

Access to 25/3 Access to 2+ 25/3 providers Access to fiber State broadband funds State broadband office or taskforce Municipal restrictions Population Size Median Income Population Density % Bachelor’s % Poverty % Housing after 2010 % Rural Topography (State Level Data) Conservative advantage % republican state legislators

slide-17
SLIDE 17

Study Summary in 2 slides (cont’d):

Do these state broadband policies matter? State broadband office State broadband funding Municipal network restrictions Overall 25/3 availability Yes (higher) Yes (lower) Fiber availability Yes (higher) Yes (lower) Two or more 25/3 providers Yes (higher) Yes (lower) Rural 25/3 availability Yes (higher) Yes (lower) Fiber availability Yes (higher) Yes (higher) Yes (lower) Two or more 25/3 providers Yes (higher)

slide-18
SLIDE 18

Conclusions

  • Strong argument that state broadband policies are having an

impact

  • Existence of restrictions on municipal / cooperative broadband hinders overall

availability

  • Broadband funding programs / offices have positive impact
  • Magnitude of impacts:
  • Typical county in 2018: 71.5% rural broadband availability
  • Including state-level funding program: (+1.8%)

73.3%

  • Removing municipal restrictions: (+3.7%)

75.2%

  • Additive in nature: Do both

77.0%

18

slide-19
SLIDE 19

Conclusions (and recent progress)

  • State Broadband Offices
  • Positive impact shown for only 2 outcomes: % of residents with 2+ providers; rural-
  • nly fiber
  • But, many states only began investing in these relatively recently
  • 8 in 2014
  • 25 by 2018
  • Benefits of these offices may take time to accrue
  • Stakeholder outreach
  • Planning / capacity building
  • Interplay between state offices / other policies?
  • Recent Momentum
  • Pew’s update for 2019 legislative session:
  • 4 additional states set up broadband task forces
  • 7 states set up their own broadband funding structures
  • 5 states reduced restrictions for cooperative broadband provision

19

slide-20
SLIDE 20

That’s all, folks!

  • Questions?
  • Comments?

brian.whitacre@okstate.edu robertog@purdue.edu

20