
SLIDE 1
St Street eet Fl Floo
- odi
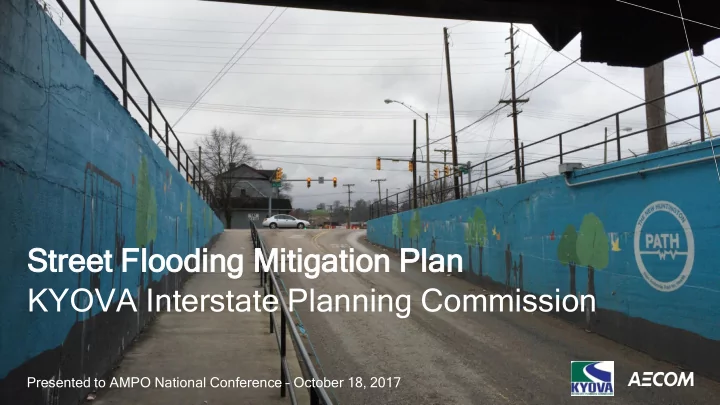
ding ng Mi Miti tiga gation tion Pl Plan an KYOVA Interstate Planning Commission
Presented to AMPO National Conference – October 18, 2017
St Street eet Fl Floo oodi ding ng Mi Miti tiga gation tion - - PowerPoint PPT Presentation
St Street eet Fl Floo oodi ding ng Mi Miti tiga gation tion Pl Plan an KYOVA Interstate Planning Commission Presented to AMPO National Conference October 18, 2017 Sa Saleem Sa Salameh, , Ph.D., P.E., M.ASCE Ch Chet Pa Parsons,
Presented to AMPO National Conference – October 18, 2017
Flood Event: December 25, 2015
responsibilities for Putnam County
Evaluate and address mobility issues due to flooding and related events Identify stormwater improvements to positively impact the traffic network Identify mitigation measures that can be taken to decrease the likelihood of future catastrophic events Study the flow of all traffic (motorized and non- motorized) through the identified problem areas
February 9, 2018 Presentation Title Page 6
Safety Infrastructure Condition Congestion Reduction System Reliability Freight Movement & Economic Vitality Environmental Sustainability Reduced Project Delivery Delays
February 9, 2018 Page 7
What hat are re the effec ective e dates es for r the e rules es estab ablishi hing ng perfo rforma rmanc nce meas easure res under nder 23 U.S.C. 150( 0(c), 49 U.S.C. 5326 26, and nd 49 U.S.C. 5329 29 and d the e associated ed two-yea ear pha hase-in n dates es for the e plann nning ng requ quiremen ements in 2 23 CFR FR Part 450 50?
Final Rule Publication Date Effective Date Two-Year Phase- In Date Statewide, Nonme metropolitan, and Metropolitan Transportation Planning May 27, 2016 June 27, 2016 May 27, 2018* Highway Safety Performance Measures (PM M #1) March 15, 2016 April 14, 2016 May 27, 2018** Pavement and Bridge Condition Performance Measures (PM M #2) January 18, 2017 May 20, 2017 May 20, 2019 System m Performance, Freight, and CMAQ Q Performance Measures (PM M #3) *** January 18, 2017 May 20, 2017 May 20, 2019 Transit Asset Management July 26, 2016 October 1, 2016 October 1, 2018 Public Transportation Safety Program m August 11, 2016 September 12, 2016 September 12, 2018 *23 CFR 450.340 references the planning rule’s publication date instead of the effective date **The two year phase-in date for the highway safety performance measures is May 27, 2018 because that date is later than the date two years after the effective date of the final rule (i.e. April 14, 2018), per the Federal Register notice for the planning rule [html] *** Greenhouse gas performance measure indefinitely delayed by FHWA’s Federal Register notice on May 19, 2017 [html]
PM #1 PM #2 PM #3
When are MPOs require red to include a descript ription of antici ticipate ted perf rforma rmance targ rget t achievemen ment t in their TIPs/MTP’s?
New, updated, or amended TIP adopted
Highway Safety Targets (PM #1) Pavement and Bridge Condition Targets (PM #2) System Performance, Freight, and CMAQ Targets* (PM#3) Transit Asset Management Targets Public Transportation Safety Program Targets May 27, 2018
September 12, 2018
October 1, 2018
May 20, 2019
* Greenhouse gas performance measure indefinitely delayed by FHWA’s Federal Register notice on May 19, 2017 [html]
Circulation
Stormwater & Green Infrastructure
Implementation of Plans
Public Participation
Bike/Pedestrian Vehicular Incident Response EMS
August 22, 2014
June 4, 2010
January 27, 1937
1st
st
8th
th
10 10th
th
16 16th
th
20 20th
th
3rd
rd
5th
th
1st
st
8th
th
10 10th
th
16 16th
th
20 20th
th
3rd
rd
5th
th
Scenario 10 chosen as test case Avoid closure at Hal Greer, 20th Street Underpass, 3rd Avenue, 5th Avenue Implementation of Optimized Alternative #1 Benefits assumed based on VHT/VMT from 2040 Scenario 10 vs 2040 No-Build Assumed implementation in 2025 and 2026
Safety due to avoided VMT Safety due to improved bike-ped connectivity Travel time / cost savings Reduced emissions Reliability Residiual Value Emergency Response Property Premium
Capital Costs Continuous O&M
June 3, 2008
Surface Overflow Undersized Sewer
Pump Station Ohio River
Existing Conditions Separation #1A Separation #1 Separation #3 Optimized #1
retention of stormwater
th Avenue
Current configuration: Four travel lanes (one way - east) Planned configuration: Three 11-foot travel lanes with a dedicated two-way cycle track, and bioretention swales adjacent to sidewalks. Pavement updated with porous asphalt or pervious pavers under the cycle track.
Current configuration: Four travel lanes (one way - east) Planned configuration: Two 11-foot travel lanes and an 8-foot two-way cycle track on the north side. Include a 10-foot center pedestrian refuge with bioretention bulbs. Install parallel parking on both sides. On the north side, install 6-foot sidewalk and a 6-foot green buffer. On the south side, install 6-foot sidewalk and 6-foot green buffer. Pavement updated with porous asphalt under the cycle track. At either end of this section of corridor, there would be an opportunity to establish gateway wayfinding to the Marshall University academic campus
Current configuration: Four travel lanes (one way - east) Planned configuration: Two 11-foot travel lanes and an 8-foot two-way cycle track on the north side. Include a 10-foot center pedestrian refuge with bioretention bulbs. Install parallel parking on both sides. On the north side, install 6-foot sidewalk and a 6-foot green buffer. On the south side, install 6-foot sidewalk and 6-foot green buffer. Pavement updated with porous asphalt under the cycle track
th
th Avenue
th Street
Current configuration: 2+2 travel lanes (bi-directional) with 4-foot sidewalk on west side and 2-foot sidewalk
Planned configuration: Two 11-foot travel lanes, a center turn lane with bioretention islands, and an elevated bicycle / multiuse path on the east side. Pavement updated with porous asphalt or pervious pavers under the multi-use path
Current configuration: 2+2 travel lanes (bi-directional) with 12-foot sidewalk and street parking on both sides from 7th Avenue north to the alley and then 2+2 travel lanes (bi-directional) with center striped turn lanes and 12-foot sidewalk on both sides from the alley north to 5th Avenue. Planned configuration: Two 11-foot travel lanes with a 6-foot center pedestrian refuge, street parking on one side, a dedicated two-way cycle track, and bioretention swales adjacent to sidewalks. Pavement updated with porous asphalt or pervious pavers under parking areas and cycle track. The northbound Hal Greer Boulevard and 5th Avenue intersection presents an opportunity to establish gateway wayfinding to the Marshall University academic campus and the stadium
th
January 27, 1937
January 27, 1937
August 22, 2014
Mainten tenanc ance Regularly maintain infrastructure – water, transportation, etc Patienc ence No quick fix for resilience issues. Takes many overlapping plans Real Numbers ers Budgets should reflect real need, no matter how tall the task A Real Team Effor
t Solutions are multi-modal and cross-disciplinary Communi unity ty Ultimately a quality of life decision
Presented to AMPO National Conference – October 18, 2017