
SLIDE 1
Better ter Mark rket et St Street eet Pr Project
- ject
Better ter Mark rket et St Street eet Pr Project oject - - PowerPoint PPT Presentation
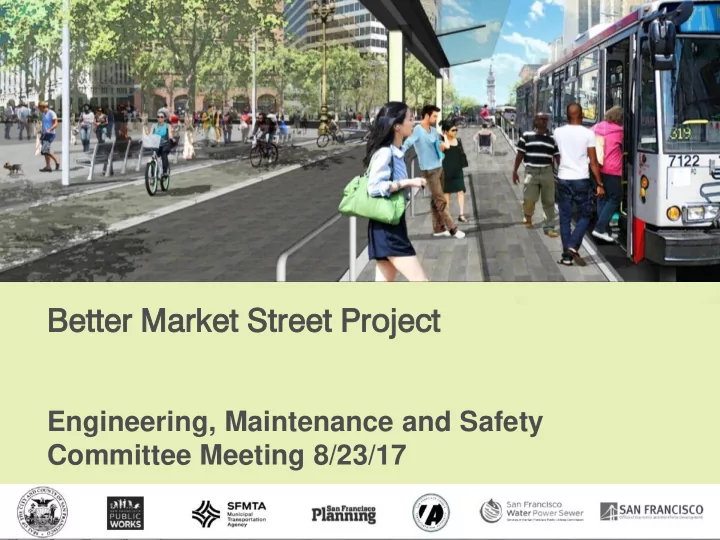
Better ter Mark rket et St Street eet Pr Project oject Engineering, Maintenance and Safety Committee Meeting 8/23/17 Market Street Market Street Citys busiest Over 100 Muni buses/hour transit corridor 14 surface transit lines +
City’s busiest transit corridor Over 100 Muni buses/hour 14 surface transit lines + BART+ Muni Metro 464K daily transit boardings 67 Muni-Auto collisions (2012-2013) City’s busiest pedestrian street 85K pedestrians per weekend day (4th to 5th) 53 Bike/Ped-Auto collisions (2012-13) City’s busiest bicycling thoroughfare Bicycle numbers have doubled since 2006 Bicycle counter data showing growth – over 3,500 riders on a good day And we all want a grand boulevard... The City’s premier civic and commercial corridor
3
– Private vehicle restrictions (buses, taxis, commercial vehicles, paratransit, and emergency vehicles exempt) – Better, clearer, more separated facilities – Commercial loading relocated onto other streets to reduce friction
– Wider transit islands – Open new crosswalks – Realign skewed crosswalks
– A continuous protected cycletrack – Two-stage left turn measures
– A BRT-like rapid service in the center track lane – New streetcar turnback loop – Travel time savings of 15-25%
11
12
13
14
– Existing stops as narrow as 5’. New 8’ wide islands to provide ADA wheelchair access. Currently only half are ADA accessible.
Existing boarding area Average 570 sq ft Future boarding area Average 1130 sq ft
15
8th St Existing lanes Extend lanes to the east 5th St Transbay Terminal
transit only lane visibility and self- enforcement
prioritize the Rapid service and improve safety through reduced lane changes
will prevent island blockages
16
Potential Layover Location Proposed Track Existing Track
CHARLES J
Cycle Track & Transit Island: Church/Duboce Market Street Today
8’ 6’ 23’
0% 20% 40% 60% 80% 100%
Market Mission
Automobile: Other Automobile: Through Movement
Market St 71% cross street 29%
(Private vehicles only; buses, taxis, bicycles, trucks, paratransit exempt)
25
(Private vehicles only; buses, taxis, bicycles, trucks, paratransit exempt)
*Alt 3 only
26
– Time-of-day restrictions (promoting nighttime deliveries) – Retaining key loading bays – Promoting last mile delivery methods
This project has been in the works for the past several years and has had over a hundred community meetings and presentations to interested parties. BMS Citizen Advisory Committee meetings since 2011. As we continue our design, the project team will perform additional outreach to the community, residents, stakeholders, community organizations, advocacy groups, and local businesses. Your input is needed to finalize paving materials for sidewalk, loading locations, and other streetscape features.
*subject to change
Date What May 2017 Sidewalk level bicycle lane design presented to Directors’ working group for approval August 2017 Identify Phase 1 segment for construction September 2017 Develop schedule for delivery of Phase 1 construction package Winter 2019 Complete Design Winter 2019 DEIR release for CEQA/NEPA Summer 2019 Complete CEQA/NEPA Summer/Fall: 2019 SF Planning Commission approval of FEIR Fall 2019 SFMTA Board approval Fall 2019 BOS legislation for sidewalks 2019 Construction of 1st segment
Ian.Trout@sfmta.com (415) 701-4556
Photo by Mark Dreger