
SLIDE 1
- T. Gundersen
E&M 01
Process, Energy and System Energy & Environment
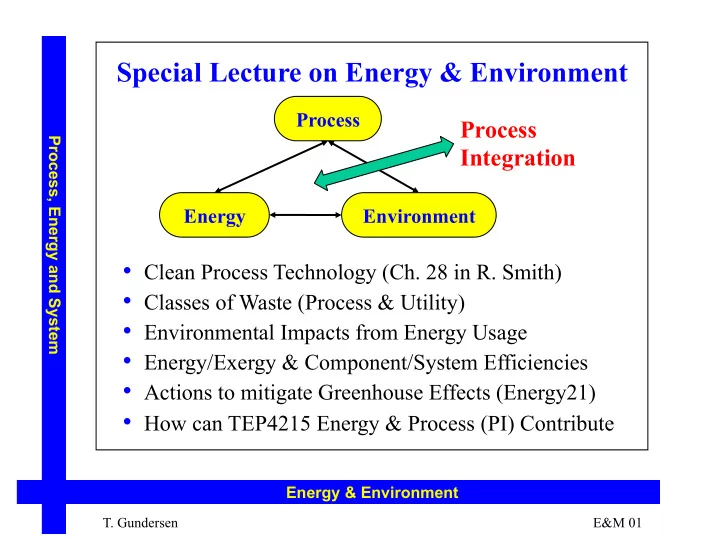
Special Lecture on Energy & Environment
- Clean Process Technology (Ch. 28 in R. Smith)
- Classes of Waste (Process & Utility)
- Environmental Impacts from Energy Usage
- Energy/Exergy & Component/System Efficiencies
- Actions to mitigate Greenhouse Effects (Energy21)
- How can TEP4215 Energy & Process (PI) Contribute