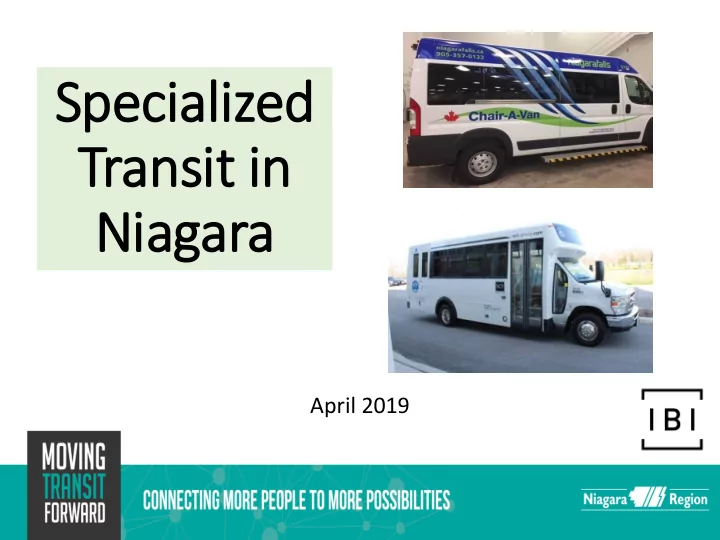

Sp Speci cial alized Tran ansi sit i t in Niaga gara ra April 2019
Presentati tion O Outl tline • Study Objectives & Work Plan • Specialized Transit in Niagara Region • Legislative Environment • Common Industry Practices • Challenges & Opportunities • Discussion: • Travel needs & requirements • What are the key issues & challenges? • An Eye on the Future
Study dy Objectives • Opportunities to maximize use of existing resources • Increase efficiencies in service delivery through policy review and development • Project future specialized transit travel demand • Develop options to best meet community’s mobility needs – Action Plan
Work P Plan
Specialized T Transit t in N Niagara • Total Operating Cost: $5M • Total Trips: 136,335 • Cost per Capita: $11.23 • Close to 5,000 registrants • Trips per Capita: 0.3044 • Cost per Trip: $36.90 Population Operating Operating Service # Registrants Total Trips Cost/Trip Cost/Capita Trips/Capita Served Cost Niagara Region 447,888 1,153 31,417 $2,239,757 $71.29 $4.71 0.0701 (NST) Niagara Falls 88,070 2,198 45,770 $541,091 $11.82 $5.55 0.5197 (Chair-A-Van) 30,710 221 7,460 $275,448 $36.92 $8.63 0.2429 Fort Erie (FAST) St. Catharines 131,400 1,049 37,452 $1,533,261 $40.94 $10.96 0.285 (Paratransit) Welland 52,293 291 14,236 $441,928 $31.04 $7.88 0.2722 (WellTrans) TOTAL 447,888 4,912 136,335 $5,031,485 $36.90 $11.23 0.3044
Compa pared t to Peers • Cost per trip – reflects peer average • Trips per capita & Cost per Capita – similar to peer averages Op. Cost Trips per Op. Cost per Region Trips Cost per Trip ($M) Capita Capita Niagara Region 136,335 $5.03M $36.90 0.3044 $11.23 Durham 180,600 $7.20M $39.87 0.26 $10.52 Halton 259,900 $6.94M $26.55 0.47 $12.66 Waterloo – Rural 47,400 $1.68M $35.44 0.8 $28.41 York 353,600 $16.00M $45.25 0.32 $14.69 Peer Average $36.80 0.4309 $15.50
Legislative E Environment “When barriers get in the way of people with disabilities participating fully in society as a result of their disabilities, everyone loses.” Accessibility for Ontarians with Disabilities Act (AODA) Specific standards for conventional & specialized transit services (Ontario regulation 191/11) What is an accessibility Accessibility Standards – include: standard? Eligibility Trip Restrictions A rule (set of measures, Hours of Service Attendants/Companions policies & practices) – organizations have to Fare Parity Origin to Destination follow to identify, remove Advance Booking Visitors and prevent barriers.
Common n Indus ustry Practices • Funding & Oversight • Determines budget & other resource levels • Planning & service monitoring • Eligibility & Certification • Centralized, others left to service provider • Range of criteria & processes • Reservations & Scheduling • Takes trip requests • Allocates drivers & vehicles to meet needs • Common use of computerized scheduling • Service Delivery • Core service – buses, vans, supplemental services (sedans) • In-house and contract operations
Common n Indus ustry Practices • Next-Generation Mobility: • Supplemental services – taxis, transportation network companies (TNCs), microtransit • Address peaking, late evenings & weekends • Technology • Computerized scheduling & dispatch • Vehicle locating & communication (AVL/ MDTs) • IVR – broadcast vehicle arrivals, etc. • App +/or web portal – registration, trip planning, reservations, confirmations, cancellations • Mobile payment
Common n Indus ustry Practices • Community Collaboratives / Entrepreneurial Partnerships: Coordinated Human/Social Service Transportation (& other community- based agencies & organizations) • Greater link/integration with fixed-route transit services • Extent may meet mobility needs – current & future? • Incentives & policies address demand /mobility management opportunities?
Challeng nges a and O Opport rtunities • Effectively manage demographics / travel demand Shared ride public transit • Address governance, program administration & for those trip management considerations in order to unable to use accessible fixed address: route transit • Increasing costs • Program & fiscal accountability • Service & scheduling efficiencies (enhancements) • Address range of functional disabilities • Address compliance with AODA STATUS QUO IS NOT SUSTAINABLE
Di Dialogue – Qu Ques estions? C Comments ts? • ISSUES & CHALLENGES ? • What works well? And not so well? • TRAVEL NEEDS & REQUIREMENTS ? Tell Us About: • Any unmet needs? • Obstacles to accessing transportation? • Strategies to address gaps or obstacles? Priorities? • The role of conventional fixed-route transit in meeting mobility needs: current & future? • Your thoughts on the role of technology?
Your Input ut What do you think An Eye on the Future? about? • Improvements to fixed- • Eligibility criteria? route transit service? • Availability of service? • Next-Gen service delivery? • Advance booking requirements? • TNCs, taxis, microtransit • On-time performance? • Technology? • Service reliability? • Transit/specialized App • Travel times? • Specialized Web portal • Fares? • Range of functionalities • Passenger Information? • Registration, trip planning, booking, Anything else? mobile payment
April 2019
Recommend
More recommend