
SLIDE 1
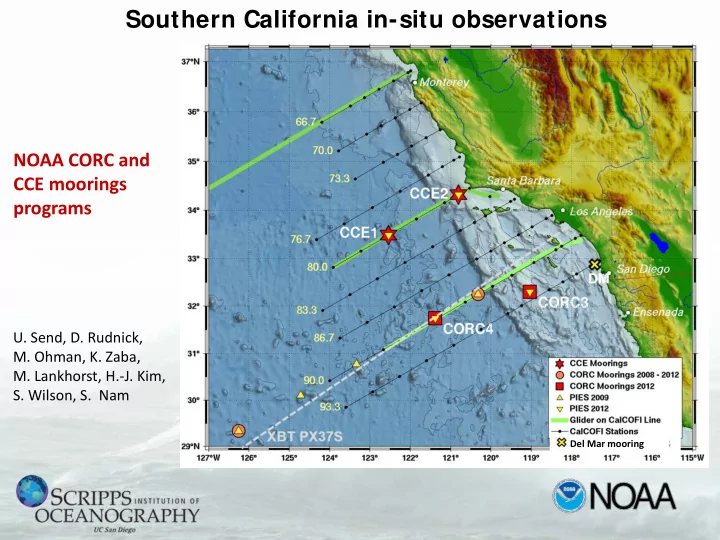
Southern California in-situ observations
- U. Send, D. Rudnick,
- M. Ohman, K. Zaba,
- M. Lankhorst, H.-J. Kim,
- S. Wilson, S. Nam
Core-CC current (CCE1) upwelling (CCE2) shelf (Del Mar)
Del Mar mooring