
SLIDE 1
1
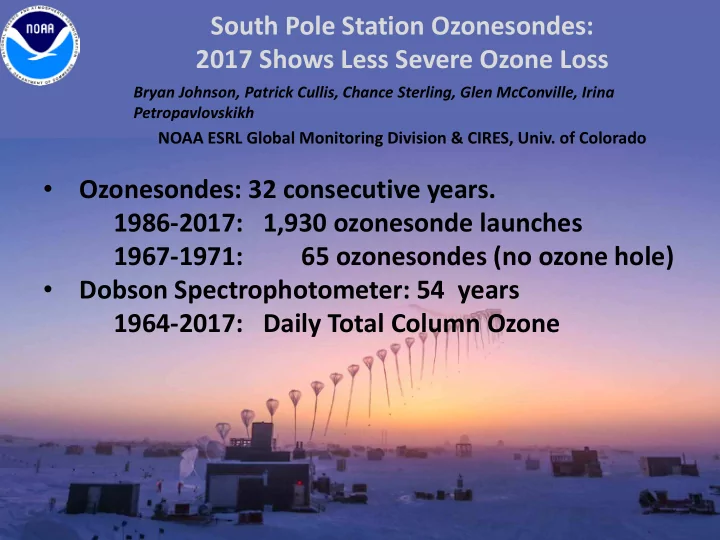
South Pole Station Ozonesondes: 2017 Shows Less Severe Ozone Loss
Bryan Johnson, Patrick Cullis, Chance Sterling, Glen McConville, Irina Petropavlovskikh
NOAA ESRL Global Monitoring Division & CIRES, Univ. of Colorado
- Ozonesondes: 32 consecutive years.
1986-2017: 1,930 ozonesonde launches 1967-1971: 65 ozonesondes (no ozone hole)
- Dobson Spectrophotometer: 54 years