
1
Software Visualization
Wesley Coelho
CPSC 533C March 29, 2004
Visualizations for Software Engineering
Visualizations for the following engineering tasks
are reviewed:
Optimization Testing Monitoring deployed software
Common themes
Overview + detail views Source code is abstracted with SeeSoft views (Eick,
Steffen and Sumner, 1992)
Reviewed Papers
Visualizing Application Behavior on Superscalar
Processors (Stolte, Bosch, Hanrahan and Rosenblum, 1999)
Technical Note: Visually Encoding Program Test
Information to Find Faults in Software (Eagan, Harrold, Jones and Stasko, 2001)
Visualization of Program-Execution Data for
Deployed Software (Orso, Jones and Harrold, 2003)
Introduction
Goal: Visualize program instruction execution on
a superscalar processor
Superscalar processors
Can execute more than one instruction per cycle Instructions can be executed out-of-order Some instructions depend on the results of other
instructions
Program source code structure can be modified
to increase instruction-level parallelism for better performance
Why Visualize?
Software developers rarely attempt such
- ptimizations
Individual instructions need to be investigated Millions of instructions are executed per
second
Programmers work with source code, not
instructions
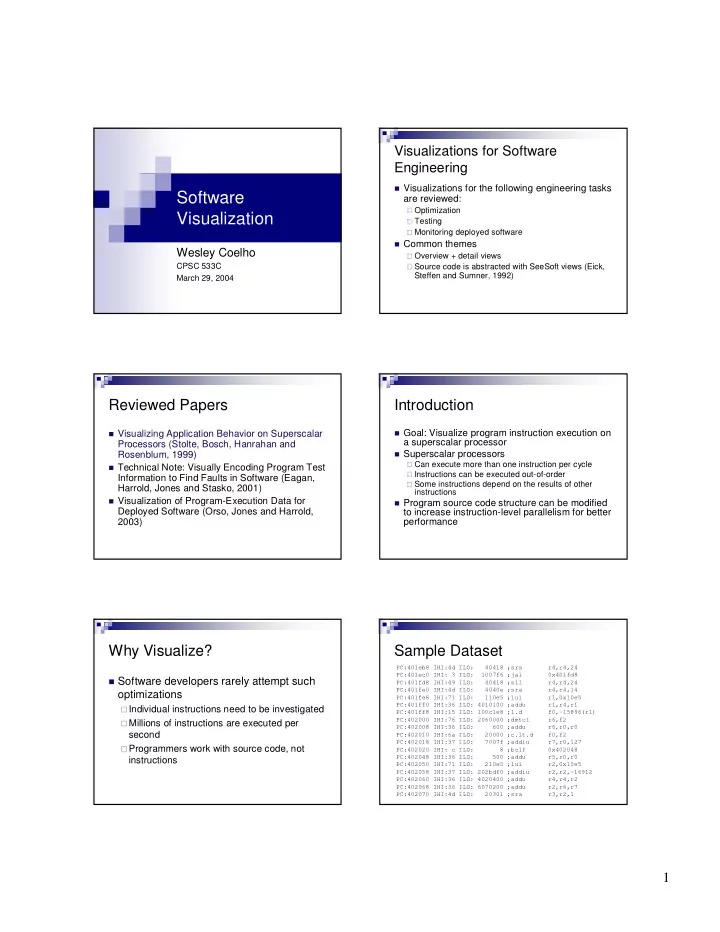
Sample Dataset
PC:401eb8 IHI:4d ILO: 40418 ;sra r4,r4,24 PC:401ec0 IHI: 3 ILO: 1007f6 ;jal 0x401fd8 PC:401fd8 IHI:49 ILO: 40418 ;sll r4,r4,24 PC:401fe0 IHI:4d ILO: 4040e ;sra r4,r4,14 PC:401fe8 IHI:71 ILO: 110e5 ;lui r1,0x10e5 PC:401ff0 IHI:36 ILO: 4010100 ;addu r1,r4,r1 PC:401ff8 IHI:15 ILO: 100c1e8 ;l.d f0,-15896(r1) PC:402000 IHI:76 ILO: 2060000 ;dmtc1 r6,f2 PC:402008 IHI:36 ILO: 600 ;addu r6,r0,r0 PC:402010 IHI:6a ILO: 20000 ;c.lt.d f0,f2 PC:402018 IHI:37 ILO: 7007f ;addiu r7,r0,127 PC:402020 IHI: c ILO: 8 ;bc1f 0x402048 PC:402048 IHI:36 ILO: 500 ;addu r5,r0,r0 PC:402050 IHI:71 ILO: 210e5 ;lui r2,0x10e5 PC:402058 IHI:37 ILO: 202bdf0 ;addiu r2,r2,-16912 PC:402060 IHI:36 ILO: 4020400 ;addu r4,r4,r2 PC:402068 IHI:36 ILO: 6070200 ;addu r2,r6,r7 PC:402070 IHI:4d ILO: 20301 ;sra r3,r2,1