SLIDE 1
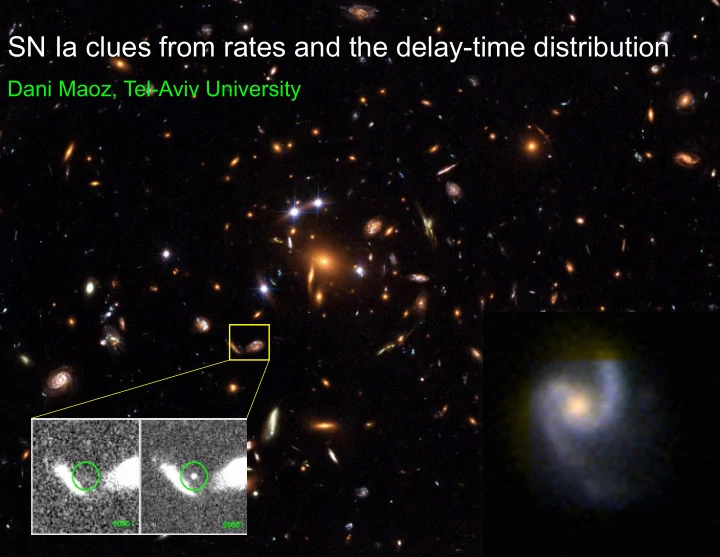
SN Ia clues from rates and the delay-time distribution
Dani Maoz, Tel-Aviv University
SLIDE 2
“single degenerate” (“SD”) (Whelan & Iben 1974) WD Main sequence, subgiant, red- giant, or “helium star”
SLIDE 3
“double degenerate” (“DD”) (Webbink 1984; Iben & Tutukov 1984)
SLIDE 4
Also: “collisional double degenerate” (Benz+, Hawley+, Loren-Aguilar+, Raskin+, Rosswog+, Thompson, Katz & Dong, Kushnir+, Garcia-Senz+…)
SLIDE 5
Also: “core degenerate” (Soker+) merger + spinup/spindown
SLIDE 6
Measuring SN Rates Can give clues to progenitors
SLIDE 7
SN Ia “delay time distribution” (DTD): = the hypothetical SN Ia rate vs. time following a short burst of star formation. Different progenitor scenarios predict different DTD
Star formation rate SN DTD
SFR t=0 time SN Rate t=0 time
SLIDE 8
e.g., Double-Degenerate scenario. Consider population of binary WDs. Time until merger of each pair (gravitational wave losses): DTD ~ t -1 expected generically
SLIDE 9
double-degenerate: DTD ~ t -1 expected generically
SLIDE 10
single-degenerate: DTD cutoff at few Gyr
similarly:
Decreasing secondary mass MS secondaries M<2 Mo cannot transfer mass stably
SLIDE 11
Recovering the delay time distribution (many different ways to do it) e.g. SN rates in galaxy clusters
SLIDE 12
SDSS 1004+4112 z=0.68 Sharon et al. (2010)
SLIDE 13
SLIDE 14
Maoz, Sharon, Gal-Yam (2010)
The SN rate vs. redshift in galaxy clusters
B10
Cosmic time
SLIDE 15 Maoz, Sharon, Gal-Yam (2010) SN rates in galaxy clusters + iron/star mass ratio Time-integrated # of SNe-Ia must produce
- bserved mass of Fe in clusters (minus mass
from CC-SNe)
SLIDE 16 Maoz, Sharon, Gal-Yam (2010) SN rates in galaxy clusters + iron/star mass ratio Time-integrated # of SNe-Ia must produce
- bserved mass of Fe in clusters
t -1.1 t -1.3
SLIDE 17 How to recover the delay time distribution
- r… volumetric SN rates vs. redshift in field, compared to cosmic
SFH
SLIDE 18 Star-formation history (z) SN rate (z)
=
time
SN delay time distribution (t)
*
time
SLIDE 19
SN rate SFH delay time dist.
SLIDE 20
SNSDF0806.50, z=1.66
SN rate vs. redshift
e.g.: SN rate at high z from the Subaru Deep Field
Poznanski et al. 2007,
Graur et al. 2011
SLIDE 21
SN rate vs. redshift
e.g.: SN rate at high z from the Subaru Deep Field
SLIDE 22
SN rates out to z=2 and beyond with HST CLASH/ CANDELS
Graur + 2014, Rodney+2015
SLIDE 23
SLIDE 24
Madau & Dickinson 14
SLIDE 25
SLIDE 26 How to recover the delay time distribution
- r… SN Rates vs. individual galaxy star-formation histories
SLIDE 27 SN rate SFH delay function
- expect. value visibility time
N = r ∙ t
- expec. value for # SNe in
given galaxy visibility time True also in an individual galaxy!
SLIDE 28
1 1 1 1 1
Compare observed number of SNe (0 or 1) in each galaxy to expectation value for given model DTD
SLIDE 29
Maoz, Brandt, Mannucci 2012
SDSS-II SNe Ia in Stripe 82 galaxies with SDSS spectra and SFHs t -1
SLIDE 30
t -1
Maoz+11, Maoz+12, Graur & Maoz 12
SLIDE 31
A SN survey among 700,000 SDSS spectra: 90 SNe Ia (Graur & Maoz 12)
SLIDE 32 How to recover the delay time distribution
- r even…SN remnants in the LMC+SMC, viewed as a SN
survey
SLIDE 33
SLIDE 34
Stellar age distributions in 1836 individual LMC/SMC “cells”, from resolved stellar populations. Harris & Zaritzky 2004, 2009
SLIDE 35
Stellar age distributions in 1836 individual LMC/SMC “cells”, from resolved stellar populations. Harris & Zaritzky 2004, 2009
SLIDE 36
Stellar age distributions in 1836 individual LMC/SMC “cells”, from resolved stellar populations. Harris & Zaritzky 2004, 2009
SLIDE 37
Maoz & Badenes 2010 SN remnants in the Magellanic Clouds and SADs from resolved stellar populations
SLIDE 38
A consistent picture:
* Wide distribution of delay times, looks like ~ t -1 (DD?)
Volumetric field rates Graur+11,14,..
SLIDE 39
Madau & Dickinson 14
SLIDE 40
SLIDE 41
Volumetric field rates Graur+11,14,..
SLIDE 42
Time-integrated SFR now matches stellar density vs. z
SLIDE 43
Madau & Dickinson 14 Core-collapse SNe: “instantaneous” after star formation CC SN rate must track the cosmic SFR. For standard IMF: 0.01 SNe per formed Msun. Expected CC rate vs. z now matches observations
SLIDE 44
A consistent picture:
* Wide distribution of delay times, looks like ~ t -1 (DD?)
Volumetric field rates Graur+11,14,..
SLIDE 45
SLIDE 46
SLIDE 47 Questions Can we find a progenitor channel(s) that:
- 1. makes things that look like normal Ia’s
and
- 2. makes enough of them (while satisfying progenitor
population observational constraints) and
SLIDE 48
Kushnir 15 CC iron yields are measurable directly from the SN light curves 0.02 Msun 0.2 Msun -
SLIDE 49
Ratio of 3:1 Types II to Ibc …. Most Type II are IIP Li+ 2011 Mean iron yield pr CC SN = ¾ * 0.02 + ¼ * 0.2 = 0.065 Msun
SLIDE 50
Howell+09
0.7 Msun -
SLIDE 51
Cosmic iron accumulation history
SLIDE 52
Cosmic iron accumulation history
SLIDE 53
all SDSS spectra, incl. ~10,000 WDs, have spectra from multiple (2-3) epochs ΔRV
SLIDE 54
Maoz et al. (2012), Badenes & Maoz (2012): Best-fit model for binary parameter distribution implies total WD merger rate ~ 1x10-13 yr-1 M1 = SN Ia rate per stellar mass in Sbc galaxies (MW)!
Observed RV distribution discriminates among models:
SLIDE 55 Ruiter+12 Ni56 mass
SN luminosity
stretch
The bivariate distribution of SN delay and explosion energy: physical link between progenitor and explosion energy
SLIDE 56
~ 3 - 7% ~(1-2)x10-3 SN-Ia/Msun ~33 Msun