
SLIDE 1
11
Introduction
CSE Department
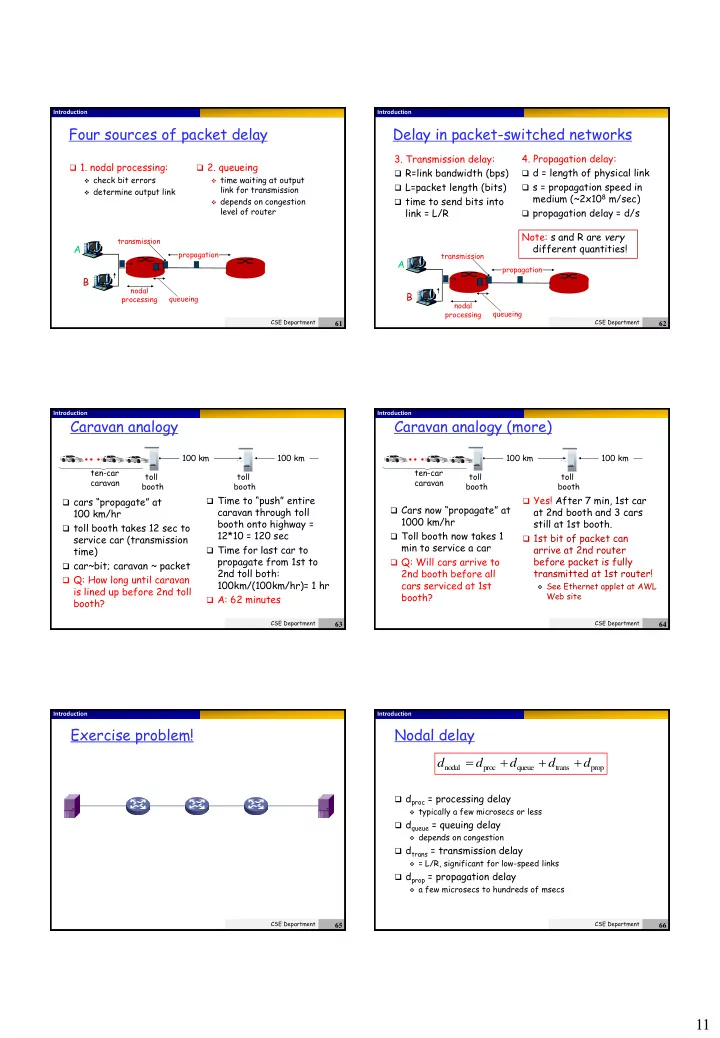
Four sources of packet delay
1. nodal processing:
check bit errors determine output link
A B
propagation transmission nodal processing queueing
2. queueing
time waiting at output
link for transmission
depends on congestion
level of router
61
Introduction
CSE Department
Delay in packet-switched networks
- 3. Transmission delay:
R=link bandwidth (bps) L=packet length (bits) time to send bits into
link = L/R
- 4. Propagation delay:
d = length of physical link s = propagation speed in
medium (~2x10⁸ m/sec)
propagation delay = d/s
A B
propagation transmission nodal processing queueing
Note: s and R are very different quantities!
62
Introduction
CSE Department
Caravan analogy
cars “propagate” at
100 km/hr
toll booth takes 12 sec to
service car (transmission time)
car~bit; caravan ~ packet Q: How long until caravan
is lined up before 2nd toll booth?
Time to “push” entire
caravan through toll booth onto highway = 12*10 = 120 sec
Time for last car to
propagate from 1st to 2nd toll both: 100km/(100km/hr)= 1 hr
A: 62 minutes toll booth toll booth ten-car caravan 100 km 100 km
63
Introduction
CSE Department
Caravan analogy (more)
Cars now “propagate” at
1000 km/hr
Toll booth now takes 1
min to service a car
Q: Will cars arrive to
2nd booth before all cars serviced at 1st booth?
Yes! After 7 min, 1st car
at 2nd booth and 3 cars still at 1st booth.
1st bit of packet can
arrive at 2nd router before packet is fully transmitted at 1st router!
See Ethernet applet at AWL
Web site toll booth toll booth ten-car caravan 100 km 100 km
64
Introduction
Exercise problem!
CSE Department
65
Introduction
CSE Department
Nodal delay
dproc = processing delay
typically a few microsecs or less
dqueue = queuing delay
depends on congestion
dtrans = transmission delay
= L/R, significant for low-speed links
dprop = propagation delay
a few microsecs to hundreds of msecs
prop trans queue proc nodal
d d d d d
66