Simulation of Flow Boiling Patterns using a Hydrogen Evolving System - - PDF document

simulation of flow boiling patterns using a hydrogen
SMART_READER_LITE
LIVE PREVIEW

Simulation of Flow Boiling Patterns using a Hydrogen Evolving System - - PDF document

Transactions of the Korean Nuclear Society Virtual Spring Meeting July 9-10, 2020 Simulation of Flow Boiling Patterns using a Hydrogen Evolving System Seong-Il Baek, Je-Young Moon and Bum-Jin Chung * Department of Nuclear Engineering, Kyung Hee


slide-1
SLIDE 1

1

Simulation of Flow Boiling Patterns using a Hydrogen Evolving System

Seong-Il Baek, Je-Young Moon and Bum-Jin Chung* Department of Nuclear Engineering, Kyung Hee University #1732 Deogyeong-daero, Giheung-gu, Yongin-si, Gyeonggi-do, 17104, Korea

*Corresponding author: bjchung@khu.ac.kr

  • 1. Introduction

Flow boiling in a vertical channel appears in many engineering applications from power electronics to heat exchangers in power plants and nuclear reactors [1-4]. The flow pattern in a heated vertical pipe is intimately related to heat transfer mechanisms including pressure drop and heat transfer rates [1,2]. Thus, it is essential to analyze the flow boiling patterns in a vertical pipe. In this study, the bubble patterns of flow boiling for a vertical pipe were simulated by a non-heating experimental method. The vaporization in heat transfer system was simulated by the hydrogen generation in the electrochemical system. The electric potential is applied to the electrode submerged in the aqueous solution of

  • H2SO4. The copper cathode acted as the heated pipe. The

inner diameter and the length of pipe were 7 mm and 500 mm, respectively. In order to analyze the characteristics

  • f hydrogen bubbles, we performed visualization using

high speed camera.

  • 2. Theoretical background

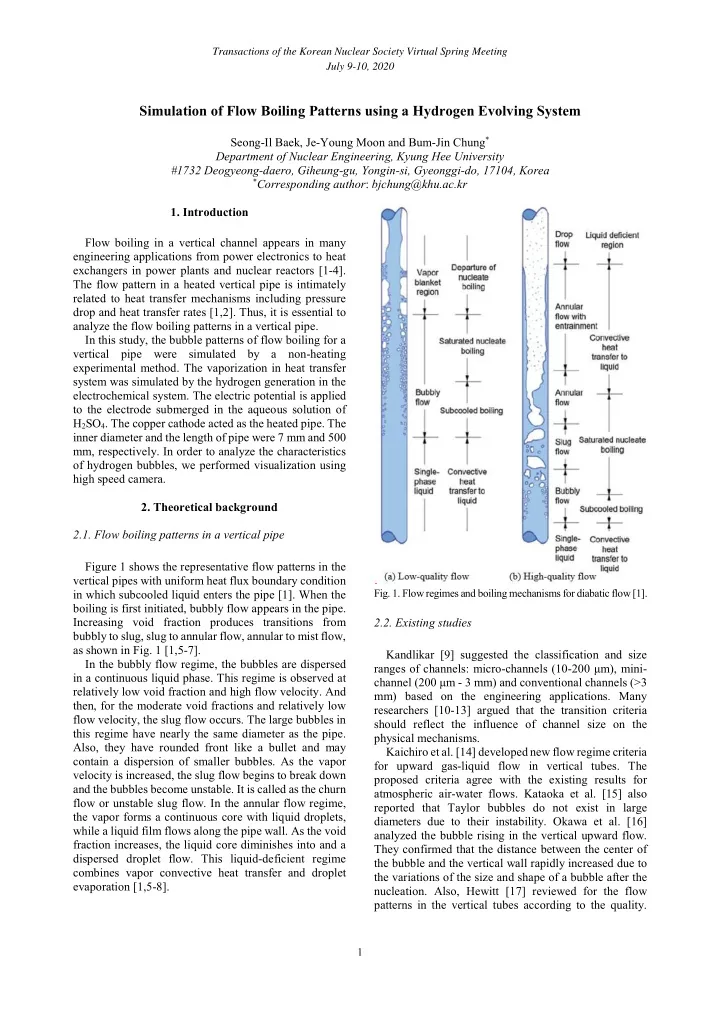
2.1. Flow boiling patterns in a vertical pipe Figure 1 shows the representative flow patterns in the vertical pipes with uniform heat flux boundary condition in which subcooled liquid enters the pipe [1]. When the boiling is first initiated, bubbly flow appears in the pipe. Increasing void fraction produces transitions from bubbly to slug, slug to annular flow, annular to mist flow, as shown in Fig. 1 [1,5-7]. In the bubbly flow regime, the bubbles are dispersed in a continuous liquid phase. This regime is observed at relatively low void fraction and high flow velocity. And then, for the moderate void fractions and relatively low flow velocity, the slug flow occurs. The large bubbles in this regime have nearly the same diameter as the pipe. Also, they have rounded front like a bullet and may contain a dispersion of smaller bubbles. As the vapor velocity is increased, the slug flow begins to break down and the bubbles become unstable. It is called as the churn flow or unstable slug flow. In the annular flow regime, the vapor forms a continuous core with liquid droplets, while a liquid film flows along the pipe wall. As the void fraction increases, the liquid core diminishes into and a dispersed droplet flow. This liquid-deficient regime combines vapor convective heat transfer and droplet evaporation [1,5-8]. .

  • Fig. 1. Flow regimes and boiling mechanisms for diabatic flow [1].

2.2. Existing studies Kandlikar [9] suggested the classification and size ranges of channels: micro-channels (10-200 μm), mini- channel (200 μm - 3 mm) and conventional channels (>3 mm) based on the engineering applications. Many researchers [10-13] argued that the transition criteria should reflect the influence of channel size on the physical mechanisms. Kaichiro et al. [14] developed new flow regime criteria for upward gas-liquid flow in vertical tubes. The proposed criteria agree with the existing results for atmospheric air-water flows. Kataoka et al. [15] also reported that Taylor bubbles do not exist in large diameters due to their instability. Okawa et al. [16] analyzed the bubble rising in the vertical upward flow. They confirmed that the distance between the center of the bubble and the vertical wall rapidly increased due to the variations of the size and shape of a bubble after the

  • nucleation. Also, Hewitt [17] reviewed for the flow

patterns in the vertical tubes according to the quality.

Transactions of the Korean Nuclear Society Virtual Spring Meeting July 9-10, 2020

slide-2
SLIDE 2

2

When heat flux of tube wall increases, the flow pattern is developed at the same axial position of tube. Recently, many researches [18-20] simulated the boiling flow behavior in the heated vertical pipe to analyze the local heat transfer characteristics and mechanism.

  • 3. Experimental set up

3.1. Experimental methodology In this system, to simulate the bubble generation by boiling, we used the evolution of hydrogen gas at the cathode surface when the applied electric potential between anode and cathode exceeds the reduction potential of hydrogen ions. The basic idea of this methodology is the superficial hydrodynamic analogy between the vapor and hydrogen bubbles once they are

  • produced. The novelty of this approach is that it allows

easy control of cell-potential and current by electric means, which correspond to surface temperature and heat flux. The boiling simulation experiments for various geometries using a hydrogen evolving system were also tested previously by our research group [21-23]. 3.2. Test matrix and apparatus Figure 2 presents the experimental apparatus and the electric circuit, which consisted of the cathode pipe, the anode wire and plate, the power supply, the data acquisition (DAQ) system and the high speed camera. The copper half pipe was used to observe the bubble pattern of channel. Inner diameter (D) and length (L) of pipe are 7 mm and 500 mm, respectively. In order to minimize the disturbance of bubble behavior, the copper wire of diameter 0.8 mm was installed on the front wall

  • f the acryl tank as shown in Fig. 2. The copper plate is

used as the additional anode whose size is 260 mm (width) by 120 mm (height). It was located at the bottom

  • f the tank. They were located in the top-opened tank (W

300 mm × L 300 mm × H 1,000 mm) filled with the sulfuric acid solution (H2SO4) of 1.5 M. The temperature of solution was measured with the mercury thermometer. The power supply (N8952A, Keysight) was used to control potential and DAQ system (34972A, Keysight) was used for recording the data. Then, the bubble pattern of channel was recorded using a 2000 fps high speed camera (Phantom VEO 710L 36G mono, Vision Research).

  • Fig. 2. Schematic design of the test electric circuit.
  • 4. Results and Discussion

Figure 3 shows the pictures of the hydrogen bubble patterns in the pipe at diabatic flow condition according to the current density. When the electric potential is applied, the bubbles are generated on the inner surface of

  • pipe. Then, they move upward due to the buoyancy and

forms various bubble patterns by coalescence of bubbles along the pipe. In Fig. 3(a), bubbly flow pattern was observed throughout the pipe at the lowest current density, 0.364 kA/m2. Bubbles grew into larger bubbles at the upper

  • part. In Fig. 3(b), bubbles similar to slug flow were

shown at the uppermost part (about 480 mm). However, the sizes of the bubbles are not as large as the pipe diameter and the bubble pattern is not repeated

  • periodically. Thus, it is hard to judge as the slug flow. On

the other hand, in case of 2.184 kA/m2, the slug flow

  • ccurs at the upper part (about 400 mm) as shown in Fig.

3(c). The size of bubbles are similar to the pipe diameter and the bubble front looks like a bullet. Also, the pattern

  • f these bubbles is regular. For 2.729 kA/m2 of the

highest current density, the slug flow was shown at the middle part (about 350 mm). Hence, compared with case

  • f the low current density, the flow pattern developed
  • faster. It is similar to results reported by Hewitt [17].

Figure 4 presents the segments of Fig.3(d) showing the transition clearly. At the lower part, the smaller bubbles were dispersed. This is bubbly flow pattern. When the bubbles move upward due to the buoyancy, the smaller bubbles coalesced into larger ones. Above the moderate part, the coalesced bubble had nearly the same diameter with the pipe. Also, these bubbles had the rounded front

Transactions of the Korean Nuclear Society Virtual Spring Meeting July 9-10, 2020

slide-3
SLIDE 3

3

like a bullet. This is slug flow pattern. Thus, the bubbly flow developed to the slug flow along the pipe. These results are similar to the bubble flow pattern as shown in

  • Fig. 1.
  • Fig. 3. Flow patterns of hydrogen bubble in a vertical pipe with

the current density.

  • Fig. 4. Hydrogen bubble patterns with the axial position for

2.729 kA/m2.

When potential is applied, the potential is used in the hydrogen reduction and copper plating. In Fig. 3, the irregular line patterns in the pipe edge were observed due to copper plating. The bubble images were partially recorded by dividing the three parts into the whole of pipe to obtain the high quality images. However, the clarity for the bubbles in the lower part of combined bubble image is low as the bubble size at this part is very small. As aforementioned, hydrogen reduction and copper plating occurred simultaneously on the cathode surface. Also, because we did not install a gas flow meter additionally, the quantitative calculation on the volume

  • f hydrogen gas was not performed. This study supposed

that all of the applied potential are used for hydrogen

  • reduction. Thus, the generation rates of hydrogen gas

were calculated by Eq. (1). ( ) 273.15

G

m

Iv nF

T V V

 (1)

Table I: Calculation results of gas generation rate of hydrogen. Current density [kA/m2] Gas generation rate [m3/s] 0.364 2.49×10⁻⁷ 1.274 8.72×10⁻⁷ 2.184 1.50×10⁻⁶ 2.729 1.87×10⁻⁶

  • 5. Conclusions

The bubble patterns of flow boiling in a heated vertical pipe were simulated and observed by a non-heating hydrogen evolving system. The hydrogen bubbles merged into the larger bubbles while the bubbles in the channel flowed to the downstream. When the current density was varied from 0.364 kA/m2 to 2.729 kA/m2, the bubble patterns at the same axial position of the pipe were developed by the vigorous coalescence of bubbles. The visualized images showed clear difference between hydrogen bubbles and vapor ones in terms of bubble diameter, nucleation site density, etc. It caused different flow pattern development and posed some limitation of the test rig design, especially thinner pipes considering smaller bubble sizes. However, the simulated flow patterns show clear superficial resemblance. The hydrogen evolving system has several advantages for boiling experiments: simple experimental apparatus, high measurement accuracy, instant control of the electric current, no thermal inertia, no radiation effect. The design of the experimental apparatus should be upgraded to eliminate the visual disturbance of anode

  • wire. Also, further studies such as the influence of the

pipe diameter and void fraction must be performed to grasp the bubble dynamics between heat and mass transfer system. In order to approach the boiling heat transfer, quantitative analyses have to be done by measuring the gas and liquid velocity and comparing the characteristics of bubble behavior for each system. NOMENCLATURE A Area [m2]

Transactions of the Korean Nuclear Society Virtual Spring Meeting July 9-10, 2020

slide-4
SLIDE 4

4

D Pipe diameter [m] F Faraday constant (96,485 Coulomb/mol) I Electric current [A] L Length [m] n Number of electrons in charge transfer reaction T Temperature [K] Vm Molar volume (0.022414 m3/mol at 273.15 K, 1 atm) 𝑊̇ G Gas generation rate [m3/s] Greek symbols ν Stoichiometric number ACKNOWLEDGEMENT This study was sponsored by the Ministry of Science and ICT (MSIT) and was supported by Nuclear Research & Development program grant funded by the National Research Foundation (NRF) (Grant code: 2017M2A8A4015283). REFERENCES [1] Y. Liu and N. Dinh, Handbook of Thermal Science and Engineering (Chap. 47, Flow boiling in tubes), Springer International Publishing, 2018. [2] M.M. Mahmoud and T.G. Karayiannis, Flow pattern transition models and correlations for flow boiling in mini-tubes, Experimental Thermal and Fluid Science,

  • Vol. 70, pp. 270-282, 2016.

[3] X. Fu, P. Zhang, C.J. Huang, R.Z. Wang, Bubble growth, departure and the following flow pattern evolution during flow boiling in a mini-tube, Vol. 53, pp. 4819-4831, 2010. [4] C.M. Callizo, Flow Boiling Heat Transfer in Single Vertical Channels of Small Diameter, Industrial Engineering and Management, KTH Royal Institute of Technology, Sweden, 2010. (Thesis) [5] L.S. Tong and Y.S. Tang, Boiling Heat Transfer and Two-Phase Flow, Second ed., CRC Press, USA, 1997. [6] G.P. Celata, K. Mishima, G. Zummo, Critical heat flux prediction for saturated flow boiling of water in vertical tubes, International Journal of Heat and Mass Transfer, Vol. 44, pp. 4323-4331, 2001. [7] V.P. Carey, Liquid-Vapor Phase Change Phenomena, Second ed., CRC Press, USA, 2008. [8] Y. Taitel, D. Bornea, A.E. Dukler, Modelling Flow Pattern Transitions for Steady Upward Gas-Liquid Flow in Vertical Tubes, AIChE Journal, Vol. 26, No. 3, pp. 345-354, 1980. [9] S.G. Kandlikar, Two-Phase Flow Patterns, Pressure Drop, and Heat Transfer during Boiling in Minichannel Flow Passages of Compact Evaporators, Heat Transfer Engineering, Vol. 23, pp. 5-23, 2002. [10] T. Harirchian, S.V. Garimella, The critical role of channel cross-sectional area in microchannel flow boiling heat transfer, Int. J. Multiphase Flow, Vol. 35, pp. 904–913,2009. [11] S.L. Qi, P. Zhang, R.Z. Wang, L.X. Xu, Flow boiling of liquid nitrogen in micro-tubes: Part II – Heat transfer characteristics and critical heat flux, Int. J. Heat Mass Transfer, Vol. 50, pp. 5017–5030, 2007. [12] J.R. Thome, Boiling in microchannels: a review of experiment and theory, Int. J. Heat Fluid Flow, Vol. 25,

  • pp. 128–139, 2004.

[13] R. Mertz, A. Wein, M. Groll, Experimental investigation of flow boiling heat transfer in narrow channels, Calore Technol., Vol. 14, pp. 47–54, 1996. [14] M. Kaichiro, M. Ishii, Flow regime transition criteria for upward two-phase flow in vertical tubes, Int.

  • J. Heat Mass Transf. Vol. 27, pp. 723–737, 1984.

[15] I. Kataoka, M. Ishii, Drift flux model for large diameter pipe and new correlation for pool void fraction,

  • Int. J. Heat Mass Transf. Vol. 30, pp. 1927–1939, 1987.

[16] T. Okawa, An experimental study on bubble rise path after the departure from a nucleation site in vertical upflow boiling, Exp. Therm. Fluid Sci. Vo. 29, pp. 287– 294, 2005. [17] G.F. Hewitt, Multiphase Flow in the Energy Industries, Journal of Engineering Thermophysics, Vol. 17, pp. 12-23, 2008. [18] Y.W. Kuang, W. Wang, R. Zhuan, C.C. Yi, Simulation of boiling flow in evaporator of separate type heat pipe with low heat flux, Ann. Nucl. Energy, Vol. 75,

  • pp. 158-167, 2015.

[19] S.M. Pouryoussefi, Y. Zhang, Identification of two- phase water-air flow patterns in a vertical pipe using fuzzy logic and genetic algorithm, Appl. Therm. Eng.

  • Vol. 85, pp. 195–206, 2015.

[20] Y. Tian, K. Zhang, N. Wang, Z. Cui, L. Cheng, Numerical study of pool boiling heat transfer in a large- scale confined space, Appl. Therm. Eng. Vo. 118, pp. 188–198, 2017. [21] S.M. Ohk, H.K. Park, B.J. Chung, CHF experiments

  • n the influence of inclination and gap size, Int. J. Heat

Mass Transf. Vol. 132, pp. 929–938, 2019. [22] H.K. Park, B.J. Chung, Simulation of critical heat flux phenomenon using a non- heating hydrogen evolving system, Front. Energy Res. Vol. 7, 139, 2019. [23] J.Y. Moon, B.J. Chung, Simulation of pool boiling regimes for a sphere using a hydrogen evolving system, International Journal of Heat and Mass Transfer, Vol. 151, 119441, 2020.

Transactions of the Korean Nuclear Society Virtual Spring Meeting July 9-10, 2020