boiling curve wall temp controlled
play

Boiling Curve Wall Temp. Controlled. Pool boiling curve for - PowerPoint PPT Presentation

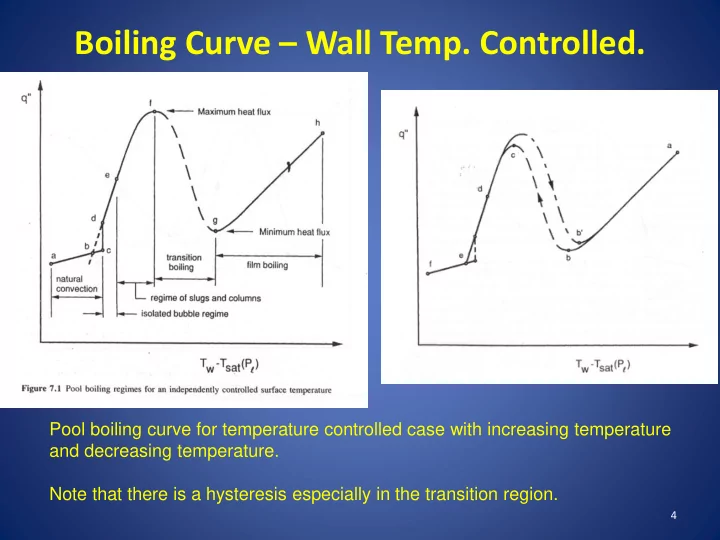
Boiling Curve Wall Temp. Controlled. Pool boiling curve for temperature controlled case with increasing temperature and decreasing temperature. Note that there is a hysteresis especially in the transition region. 4 Pool Boiling Curve


  1. Boiling Curve – Wall Temp. Controlled. Pool boiling curve for temperature controlled case with increasing temperature and decreasing temperature. Note that there is a hysteresis especially in the transition region. 4

  2. Pool Boiling Curve – Wall Temperature Controlled  Low superheats: no nucleation sites active, natural convection only mode of heat transfer.  As Tw increases, ONB occurs at point c , causes heat flux to increase, system operating point moves from c to d .  Initially only few sites are active, with increasing superheats, more sites become active, operating point moves along d-f in the figure.  Vapor gets produced very rapidly such that bubbles merge to form columns of vapor slugs and rise upward. (Region e-f )  Increasing wall temperature (and hence heat flux), eventually causes vapor drag on the liquid moving to the surface to be so severe that fresh liquid is prevented from reaching the surface fast enough to keep the surface wetted.  Vapor patches accumulate at some locations, evaporation of the liquid between surface and some patches dries out portions of the surface. 6

  3. Pool Boiling Curve – Wall Temperature Controlled • If Tw is held constant, local heat transfer at locations of dry patches is much lower than wetted portions. • Thus, mean overall heat flux from the surface reduces. The peak value of flux is called “ critical heat flux ”, denoted by point f , on the curve. • Further increase in wall temperature results in a regime where wall heat flux decreases, this is shown by region f-g called transition boiling regime . • Rapid and severe fluctuations in the local surface heat flux occur due to the fact that the dry regions are generally unstable, existing momentarily at a location before collapsing and allowing the surface to get rewetted. • At higher wall temperatures, the vapor film can be sustained for longer intervals, thus the time averaged heat fluxes are reduced.

  4. Pool Boiling Curve – Wall Temperature Controlled • As the trend continues, a point is reached when the surface is hot enough to sustain a stable vapor film on the surface for indefinite period of time. This is called film boiling regime. The transition occurs at point g . • In film boiling, heat flux monotonically increases as superheat increases – as a result of increased conduction and / or convection due to increased driving temperature difference across the vapor layer. • Radiation also becomes important due to the high temperatures encountered. • When a stable film exists on the surface, it is called Inverted Annular Film Boiling (IAFB), with increased vapor formation, turbulence in the film and liquid core, waviness of the interface leads to breakdown of the interface leading to transition to Dispersed Flow Film Boiling (DFFB), where in liquid is in the form of ligaments and droplets entrained in the vapor core.

  5. Pool Boiling Curve – Wall Temperature Controlled • With further increase in wall superheats, the dispersed droplets become smaller in size due to evaporation leading eventually to a finely dispersed liquid phase in the fast moving vapor phase. Reduction in Surface Temperature: • If the wall surface temperature is reduced slowly, system progresses through each of the regimes in reverse order. • However the path of the curves, especially in the transition boiling regime (may be below the increasing superheat curve) is different. • The transition between nucleate boiling and natural convection will be significantly different. The nucleate boiling curve merges into the natural convection curve.

  6. Pool Boiling Curve – Wall Heat flux Controlled • Boiling curve takes a slightly different character than the wall temperature controlled case. Boiling curve for increasing heat flux Boiling curve for decreasing heat flux

  7. Pool Boiling Curve – Wall Heat flux Controlled • For increasing heat flux, at ONB condition in this case, as heat flux is constant, the curve shifts to the left (lower wall temperature) from the natural convection case, indicating an increase in the heat transfer at ONB (from c to d, first curve). • When heat flux is increased beyond CHF, the surface temperature jumps to a high value in film boiling curve ( from f to g, first curve ) . Transition boiling regime is not observed!! • If the heat flux is slowly decreased for a surface already in film boiling, curve tracks down up to the minimum heat flux value possible to sustain film boiling (Leidenfrost point, point b in second curve). • Further decrease in heat flux causes system operating point to jump to point c {second curve} along the nucleate boiling curve. • Once again ‘transition boiling’ regime is bypassed.

Download Presentation
Download Policy: The content available on the website is offered to you 'AS IS' for your personal information and use only. It cannot be commercialized, licensed, or distributed on other websites without prior consent from the author. To download a presentation, simply click this link. If you encounter any difficulties during the download process, it's possible that the publisher has removed the file from their server.

Recommend


More recommend