
SLIDE 1
Chen’s Model for Saturated Boiling
NB c
h h h
2
t coefficien transfer heat
- f
component boiling Nucleate : t coefficien transfer heat
- f
component Convective :
NB c
h h
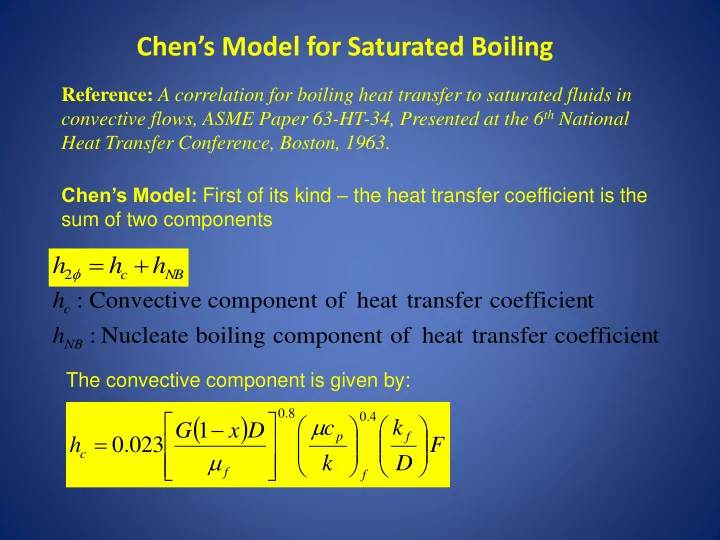
Reference: A correlation for boiling heat transfer to saturated fluids in convective flows, ASME Paper 63-HT-34, Presented at the 6th National Heat Transfer Conference, Boston, 1963. Chen’s Model: First of its kind – the heat transfer coefficient is the sum of two components The convective component is given by:
F D k k c D x G h
f f p f c
4 . 8 .