
SLIDE 1
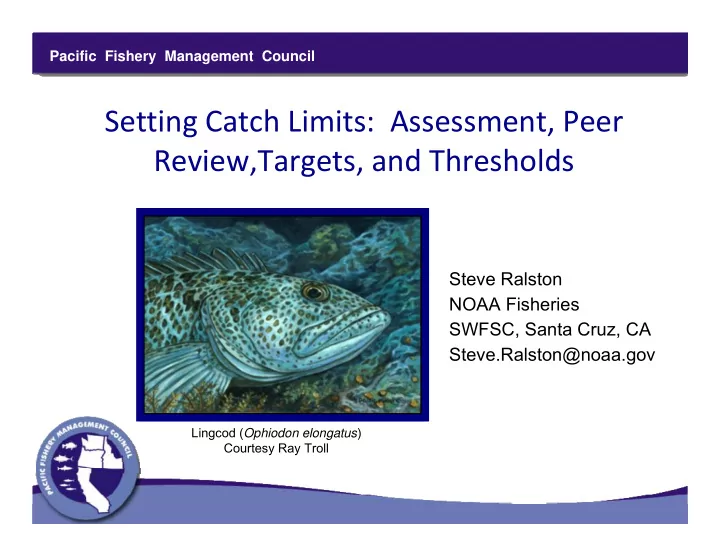
Setting Catch Limits: Assessment, Peer Review,Targets, and Thresholds
Steve Ralston NOAA Fisheries SWFSC, Santa Cruz, CA Steve.Ralston@noaa.gov
Lingcod (Ophiodon elongatus) Courtesy Ray Troll
Pacific Fishery Management Council
Setting Catch Limits: Assessment, Peer Review,Targets, and Thresholds - - PowerPoint PPT Presentation
Pacific Fishery Management Council Setting Catch Limits: Assessment, Peer Review,Targets, and Thresholds Steve Ralston NOAA Fisheries SWFSC, Santa Cruz, CA Steve.Ralston@noaa.gov Lingcod ( Ophiodon elongatus ) Courtesy Ray Troll Pacific
Steve Ralston NOAA Fisheries SWFSC, Santa Cruz, CA Steve.Ralston@noaa.gov
Lingcod (Ophiodon elongatus) Courtesy Ray Troll
Pacific Fishery Management Council
Pacific Fishery Management Council
Pacific Fishery Management Council
Starry flounder Platichthys stellatus Courtesy Ray Troll
Stock Assessment Allowable Biological Catch (ABC) Harvest Policy Exploitable Biomass Promulgate Regulations Socioeconomic, Allocation, and Other Issues Optimum Yield (OY) OY < ABC Pacific Fishery Management Council Stock Assessment Team
“Wall of Science”
A three meeting process, with a five month notice and comment period, to be conducted once every 2 years
science review
Terms of Reference
Pacific Fishery Management Council
Title Page and Authors Executive Summary Introduction Assessment Data – landings, compositions, surveys, sample sizes, CVs, etc. Modeling History – response to previous STAR and GAP comments Model Description – fleets, likelihood components, constraints, etc. Model Selection – parsimony vs. realism, likelihood profiles, residuals Base run – all model parameters, time series, selectivities, S-R, etc. Reference Points Harvest Projections & Decision Tables Regional Management Considerations Research Needs Appendices – parameter and data files Pacific Fishery Management Council
Introduction STAR Goals and Objectives Shared Responsibilities NMFS Responsibilities STAT Responsibilities GMT Responsibilities GAP Responsibilities SSC Responsibilities Council Staff Responsibilities Stock Assessment Priorities Terms of Reference for STAR Panels and Their Meetings Suggested Template for STAR Panel Report Terms of Reference for Groundfish STAT Teams Terms of Reference for Stock Assessment Updates Appendix A: 2009-2010 Stock Assessment Review Calendar Appendix B: Outline for Groundfish Stock Assessment Documents Appendix C: Template for Executive Summary Prepared by STAT Teams Appendix D: Example of a Complete Stock Assessment Executive Summary Pacific Fishery Management Council
Pacific Fishery Management Council
Pacific Fishery Management Council
Canary rockfish (Sebastes pinniger)
Pacific Fishery Management Council
A creative role for the STAR panel
0.00 0.05 0.10 0.15 0.20 0% 10% 20% 30% 40% 50% 60% 70% 80% 90% 100% Spawning Output as a % of Virgin Spawning Allowable Biological Catch / Optimum Yield 40-10 strategy ABC ABC is based on Fmsy or its proxy OY is reduced if spawning potential is below 40% of K
control rule for translating stock size into optimum yield
Pacific Fishery Management Council
0% 20% 40% 60% 80% 100% 120% 1960 1965 1970 1975 1980 1985 1990 1995 2000 2005 2010
Year Relative Depletion
Canary Bocaccio Cowcod POP Darkblotched Widow Yelloweye
Pacific Fishery Management Council
500 1,000 1,500 2,000 2,500 3,000 3,500 4,000 1990 1992 1994 1996 1998 2000 Year Metric Tons Catch ABC
Canary rockfish
Stock assessments
Pacific Fishery Management Council
25 50 75 100 10 20 30 40 50 60 Years Probability of rebuilding
F=0 50% 70%
rebuilding with no fishing
1 generation
Tmax Tmin
Possible range
Pacific Fishery Management Council
bocaccio Sebastes paucispinis
– a 25% precautionary reduction in ABC is applied
– a 50% precautionary reduction in ABC is applied
Pacific Fishery Management Council
Pacific Fishery Management Council
Chinook salmon Oncorhynchus tshawytscha Courtesy Ray Troll
Pacific Fishery Management Council A happy fisherman
Pacific Fishery Management Council
Pacific Fishery Management Council
Prediction can be for the entire run
Pacific Fishery Management Council
Pacific Fishery Management Council
Pacific Fishery Management Council
Pacific Fishery Management Council
Jacobson, L. D., and A. D. MacCall. 1995. Stock-recruitment models for Pacific Sardine (Sardinops sagax). Can. J. Fish. Aquat. Sci. 52:566-577.
Pacific Fishery Management Council
Pacific Fishery Management Council