
SLIDE 1
September 2019 History & City Connections Started as City - - PowerPoint PPT Presentation
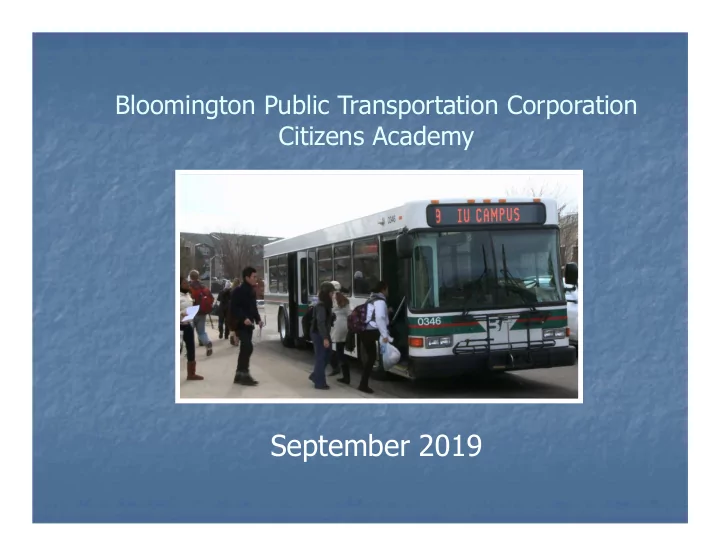
Bloomington Public Transportation Corporation Citizens Academy September 2019 History & City Connections Started as City Department in 1973 Became Public Transportation Corp. in 1982 5-Member Governing Board Board Appointed by
Started as City Department in 1973 Became Public Transportation Corp. in 1982 5-Member Governing Board Board Appointed by Mayor & City Council City Council Approves Budget Contract with City for Legal, Insurance, ITS
1988 - 1st Year to Reach ½ Million 1999 - 1st Year to Reach 1 Million 2003 - 1st Year to Reach 2 Million 2009 - 1st Year to Reach 3 Million 2014 – 1st Year to Reach 3.5 Million
5 10 15 20 25 30 35 40 45 50
Bloomington Lafayette Muncie Evansville Indianapolis Gary South Bend
Indiana Cities 2018 Ridership Per Capita
For Persons with
36,428 Annual
Eligibility and
Completed 2014 LEED Silver Design Enhanced Amenities
AC, Wifi, Restrooms,
8 Hybrids in Fleet 20+% of Fleet Hybrid Better Fuel Efficiency Reduced Emissions Reduced Noise 2019 Budget Includes
Locate Your Bus in
Est. Arrival Time at All
3 Million Annual Page
150,000+ Users
Bus Arrival Message
l
Personnel 42.99% Services 10.81% Fuel/Oil 6.62% Parts & Supplies 5.1% Capital 34.48%
State 18.24% Federal 45.01% Property Tax 9.71% IU Revenues 9.88% Passenger Fares 4.51% Other Local Taxes 4.21% Reserves 6.44% Misc & Other 2.0%
National and Local Decline in Transit Ridership Lack of Growth in State PMTF Revenues Governor’s Reversions on PMTF Funding Federal Gas Taxes Unchanged Since 1993 IU Funding Flat for Three Years Prior Future of Fuel Costs
Annexation? Route Network Redesign
Fall Public Meetings New Hospital Service Ivy Tech/Cook Service Microtransit? Implement Aug 2020
Transit Linkages Funded by Student Developments? Alternative Fuels – Electric or CNG? New Local Funding Source to Grow Transit?